90% of analytics and business professionals say that data analytics is the key to their organization’s digital transformation initiatives. But analyzing data is of no use if the data is not presented and shared via insightful reporting.
Many tools you use in your work offer some reporting function. However, as your projects get complex, you’ll need to collate data from multiple sources and report in a unified manner.
That’s where a great reporting application can fill the gap. It pulls your arbitrary data scattered over different places and converts that data into comprehensible, insightful reports. The result: You make informed decisions to improve your campaigns, projects, and the whole organization.
In this article, we’ll help you get a quick overview of the best reporting software on the market. So you can pick the right solution for your needs.
11 Best Reporting Tools of 2021
Here’s our list of the best reporting tools for you to consider, along with brief descriptions and notable features that make them stand out.
- Piktochart — Best for businesses that need straightforward reporting
- Holistics — Best for data scientists and engineers who know their way around SQL
- Microsoft Power BI — Best reporting platform for large-scale organizations
- Supermetrics — Best for users who want to process and share data with 3rd-party integrations
- Hubspot Marketing Analytics — Best for marketers to integrate all campaign data in one place
- Thoughtspot — Best reporting tool for novice users
- Octoboard — best for businesses looking for automated reporting
- Whatagraph — best for creating custom cross-channel marketing reports
- Google Data Studio — best for users looking for free reporting software
- Tableau — best reporting tool for embeddable and mobile-friendly analytics reports
- Zoho Analytics — best for complex teams using different methods and democratized reporting
1.Piktochart — Best for businesses that need straightforward reporting
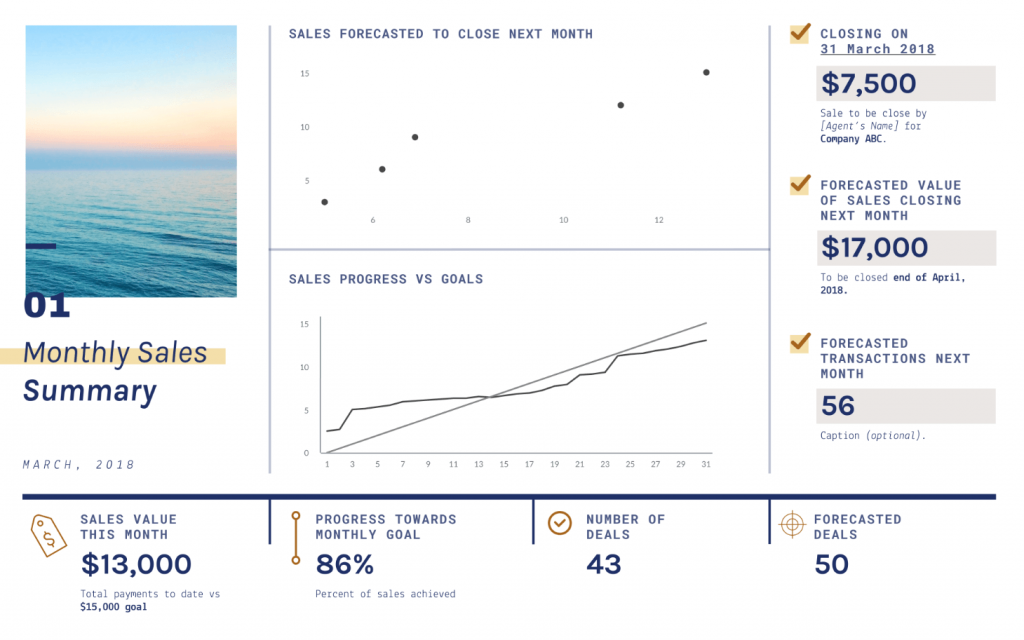
Piktochart is a reporting solution for several purposes, including sales, marketing, HR, and social media. You can generate these reports without any coding or professional design skills. Its drag and drop editor and a large collection of pre-built templates make report generation quick and painless.
Notable features of Piktochart include:
- An intuitive drag and drop editor that requires minimal prior training
- Plenty of customizable report templates designed by professionals
- Integration with MS Excel or Google Sheets to create graphs that update automatically with changes in your data source
- Gather several charts into a single page to create interactive dashboards
2.Holistics — Best for data scientists and engineers who know their way around SQL
Holistics.io is a reporting solution that helps data science professionals get answers to questions that matter. Its interface takes you straight to SQL in order for you to engage in an advanced level of analytics.
Notable features of Holistics include:
- It cuts your data-wrangling efforts by half so that you can focus on high-level analysis.
- Designed to work seamlessly with your current data infrastructure, so you can start working right away.
Downside: Using Holistics can be challenging for non-technical users who are not familiar with SQL.
3.Microsoft Power BI — Best reporting platform for large-scale organizations
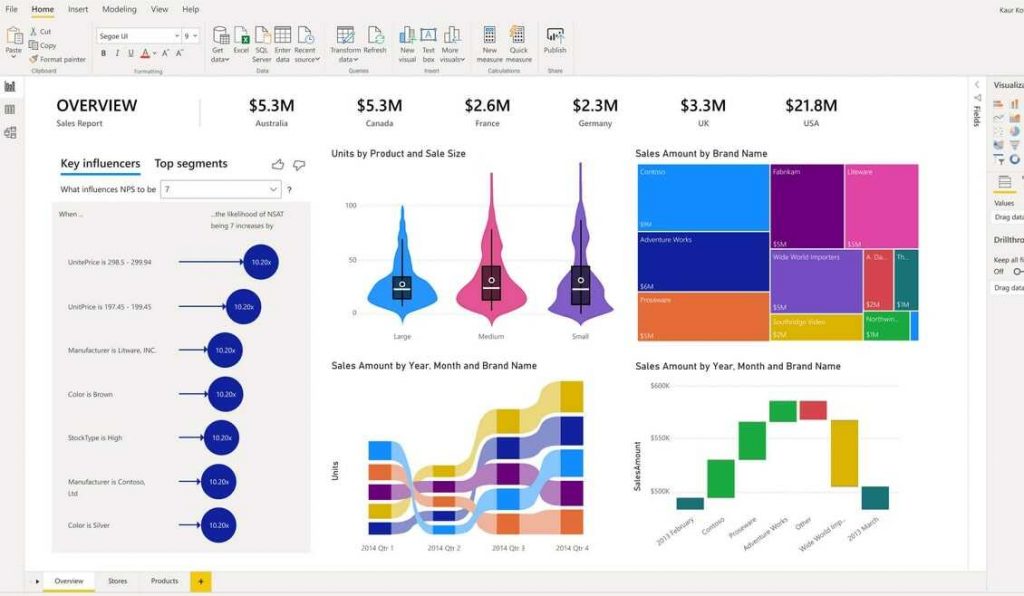
Microsoft Power BI offers a group of reporting tools for self-service and enterprise-level analytics and data visualization. It helps ingest, interpret, and share information using pre-built and customizable reports in a way that’s easy to digest. With this tool, you can generate ad-hoc as well as scheduled reports meant for different types of users, such as employees, managers, and the C-suite.
Notable features of Microsoft Power BI include:
- 120+ free native data source connectors
- A large collection of pre-built visuals
- Interactive, mobile-responsive dashboards with drill-down features
- Split reports into separate pages
- Embed reports in a custom SaaS or other application
- Protect data exports with sensitivity labels
- Configure security at Workspace as well as row levels
- The Interface supports quick querying of data based on natural language
- Data preparation and modeling based on AI
- Support for multiple languages, such as DAX, SQL, Power Query, Python, and R
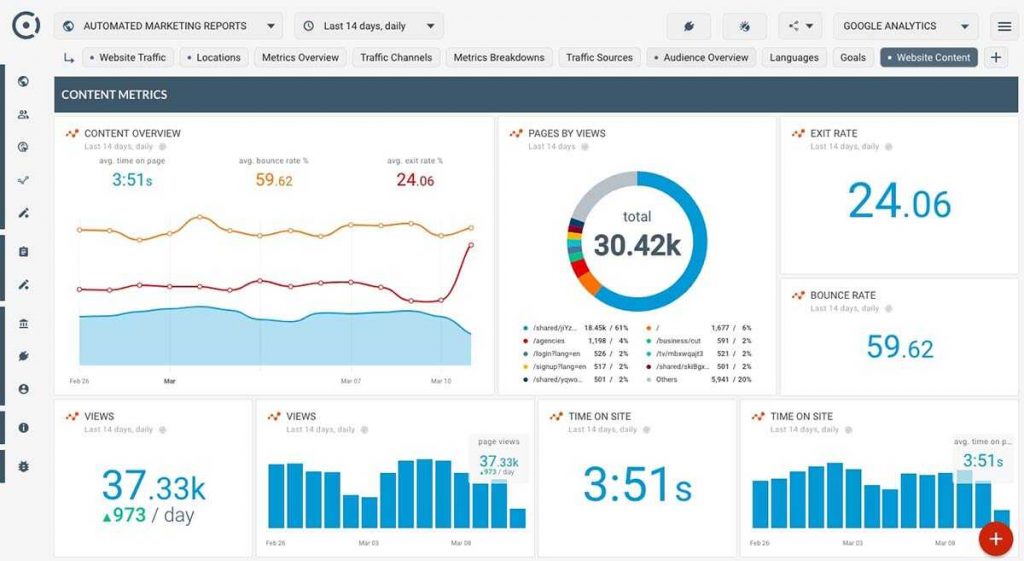
4.Supermetrics — Best for users who want to process and share data with 3rd-party integrations
Supermetrics can collect and process data using APIs. This reporting software can also send the processed data to another tool with the help of Supermetrics integrations. These include PPC tools, social media, SEO tools, and Google analytics.
Notable features of Supermetrics include:
- Schedule reports are gathered automatically and sent to your email in CSV format
- Templated reports designed by expert data analysts
- Cross-platform reporting to compare performance across each campaign in one place
Downside: This reporting tool lacks monitoring of data quality and doesn’t give you the ability to build attribution-based reports.
5.Hubspot Marketing Analytics — Best for marketers to integrate all campaign data in one place
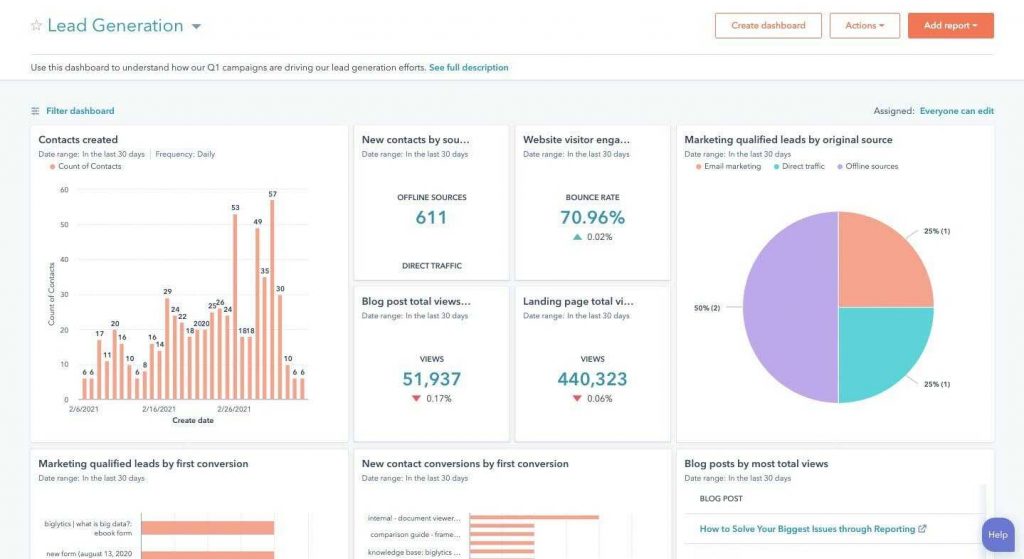
Hubspot is a reporting application that allows you to report the performance of your entire marketing funnel in a single location, with built-in analytics reports and dashboards.
It supports reporting on marketing campaigns that include blogging, email automation, landing pages, lead management, SEO, advertising, and social media.
Notable features of Hubspot Marketing Analytics include:
- Measure complete marketing funnel from traffic acquisition to closing a sale
- Track all customers, including anonymous visitors and repeat buyers
- Discover important trends over a period of time
- Analyze website performance with your chosen KPIs
- Supports detailed reporting for each marketing channel separately
6.Thoughtspot — Best reporting tool for novice users

Thoughtspot is a simple, self-service reporting tool to create interactive data apps based on APIs — data apps that are compatible with your existing cloud ecosystem. It also allows users to send reports to the other business apps they use for ease of analysis.
Notable features of Thoughtspot include:
- Conditional formatting for pivot tables to uncover patterns and trends based on set criteria
- Connect and run live interactive queries
- REST-based APIs for content sharing, trusted authentication, profile updates, and assigning tags
- Configure settings for custom actions, including local, or global scope
- Advanced search and AI functionality to create interactive dashboards
Downside: Thoughspot doesn’t claim to be a no-code platform, but rather a low-code platform. So if you aren’t familiar with coding, it may be difficult to use.
7.Octoboard — best for businesses looking for automated reporting
Octoboard is another popular reporting solution that lets you collect and use business data, as well as automate client reporting. It can generate reports related to sales, web analytics, marketing, finance, and advertising. These reports can then be shared via your website, Slack, office TV screens, or automated emails.
Notable features of Octoboard include:
- Send professional-looking automated reports to clients on a regular basis
- Share white-label client reports in a secure portal hosted on your website
- Readymade templates to create custom dashboards
- Integration with 2500+ Zapier apps
8.Whatagraph — best for creating custom cross-channel marketing reports

Whatagraph is an intuitive reporting application to create attractive marketing reports for campaigns related to social media, SEO, and more. As such, it’s a great solution for beginners and advanced marketers alike, especially those who handle multiple client accounts.
Notable features of Whatagraph include:
- 30 data integrations to connect with Facebook, Google Sheets, Hubspot, etc.
- Pre-built report and dashboard templates
- Reports are displayed as separate customizable widgets
- Automatic report generation and delivery
- Support for using custom data via Public API or Google Sheets
- Real-time tracking of goals and KPIs
Downside: It can often feel buggy, and some features are hard to understand.
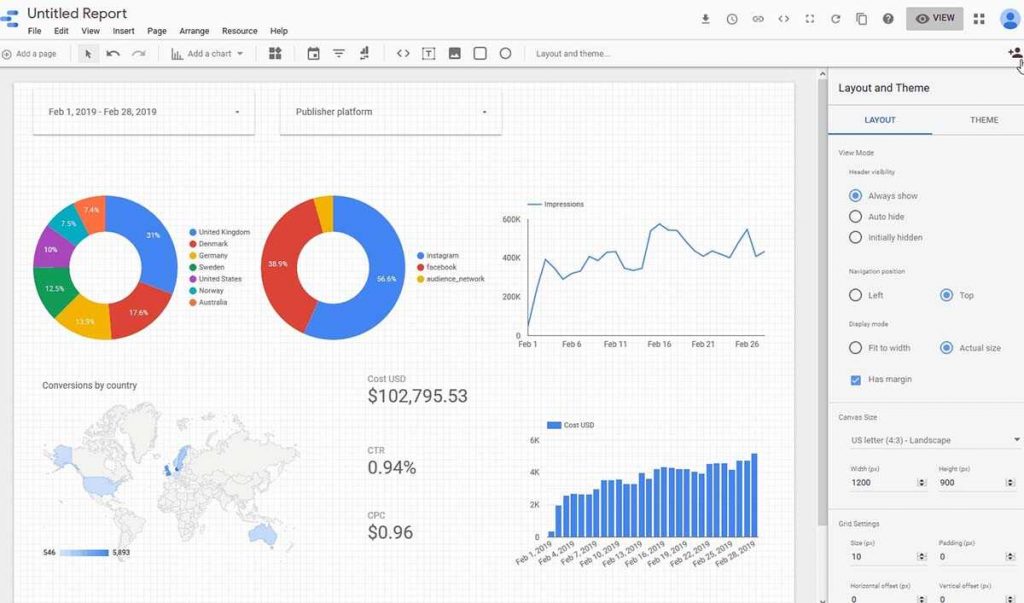
9.Google Data Studio — best for users looking for free reporting software
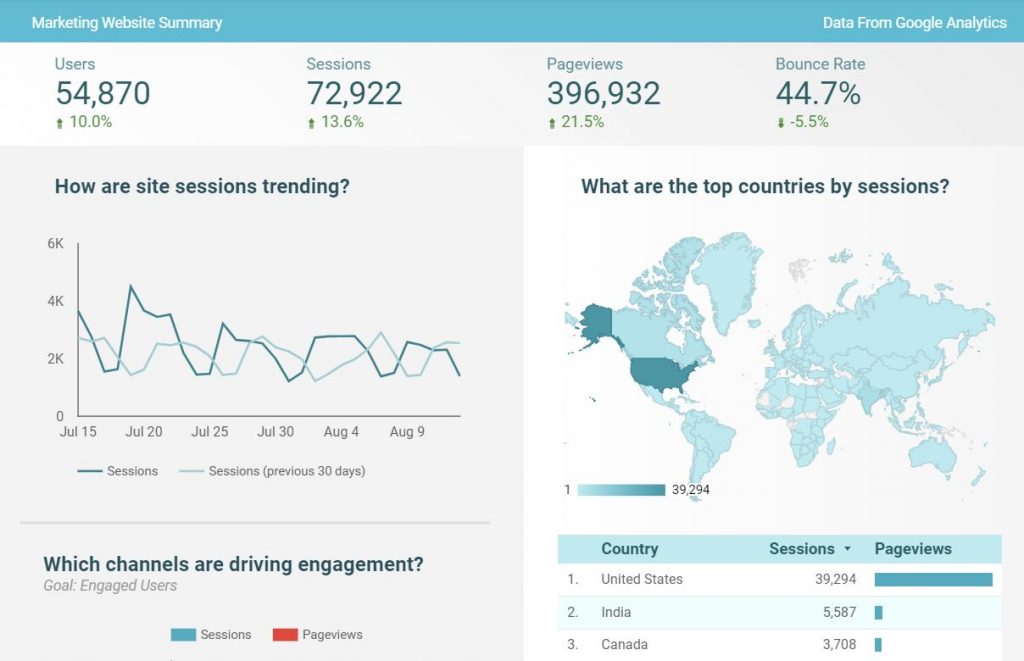
If you’re looking for reporting software at no cost, this is it. With Google Data Studio, you can configure a connector to pull and compare your information, set up interactive dashboards, and build visualizations to explore the collected data — all for free. Data can be fetched from spreadsheets, Google Analytics, Google Ads, Google BigQuery, and more.
Notable features of Google Data Studio include:
- Handles data authentication, structure, transformation, visualization, and access rights, without writing SQL queries or code
- Pre-built data connectors to import from sources such as Google Ads, Campaign Manager 360, MySQL, and so on
- Drag and drop report builder to create highly customizable and shareable charts and graphs
- Team members can collaborate with user-level or group-level permissions to edit, add comments, and handle different versions of reports and dashboards.
Downside: Performance can be limited when you add more than two data sources. A workaround for this issue is to collect all the data in one dataset in Google BigQuery. That way, you can integrate it with Google Data Studio as a single source.
10.Tableau — best reporting tool for embeddable and mobile-friendly analytics reports
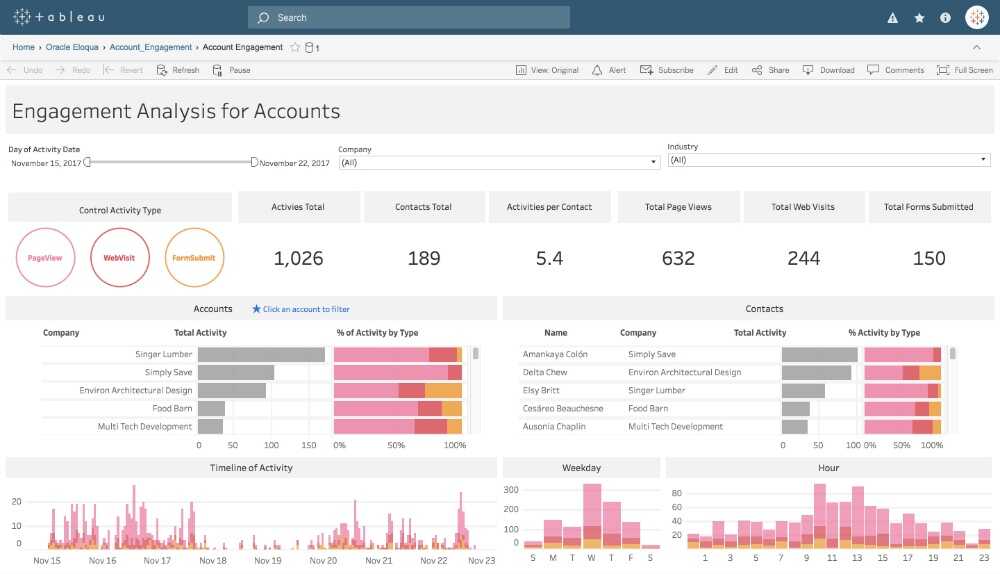
Tableau is a popular data visualization and reporting solution. It pulls data easily from multiple sources and formats. You can create a wide range of attractive reports without coding, reports that look great on devices of all shapes and sizes.
Notable features of Tableau include:
- 150+ built-in functions
- Several pre-built data connectors for quick ad hoc report generation
- Drag and drop features to build interactive dashboards
- Sharing reports quickly across the company with user access controls
Downside: It is known to often fall short when analyzing time-series data.
11.Zoho Analytics — best for complex teams using different methods and democratized reporting
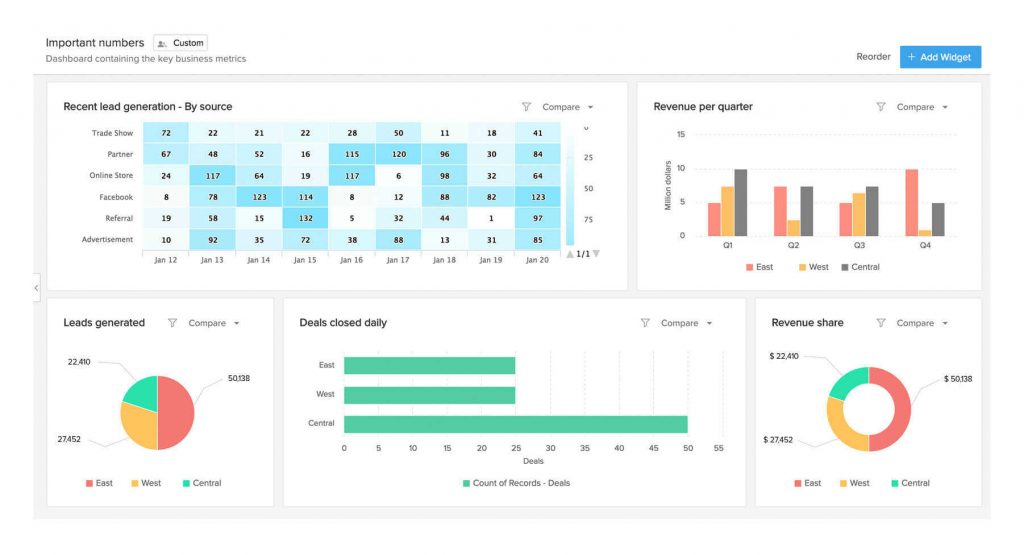
Zoho Analytics is a reporting tool that focuses on both automation and usability, checking your data automatically for gaps, errors, and so on. It’s especially suitable for teams with a democratized data analytics approach and situations in which several levels of technical sophistication are being used.
Notable features of Zoho Analytics include:
- Cross-functional report generation without building a query
- 100+ connectors, along with pre-built dashboards and reports
- User access control to define who can see the reports
- Smart data notifications and forecasting
Downside: There are some sophisticated reports that require a certain level of coding know-how.
Final Thoughts
When it comes to selecting reporting software, there’s no dearth of choices. Having a number of options gives you more freedom, but also makes it hard to zero in on the final decision.
So we hope that the above list will help you narrow down the available choices and pick a reporting tool that helps you share great insights with your team and your whole organization with ease.
About The Author
Hitesh Sahni is a content strategy consultant, editor, and founder of Smemark, an upscale content marketing studio helping brands and agencies in multiple niches accelerate growth with superior, scalable content writing for 10+ years. Get his 5 essential templates & worksheets to kickstart content creation, free.