Piktochart vs Canva
For businesses, Piktochart offers a way to turn dry, boring data into a clear story that gets the message across — even if you have no design experience.
Try Piktochart for free


💯 Learn how to effectively get your message across with the Fundamentals of Visual Storytelling course.
For businesses, Piktochart offers a way to turn dry, boring data into a clear story that gets the message across — even if you have no design experience.
Try Piktochart for free
Canva has a ton of cool templates and visuals, but you end up spending more time browsing templates than getting your work done. Piktochart puts the emphasis on getting your message across through visual communication in the shortest time possible.
 Personalized customer service
Because Piktochart is a smaller company, we can provide our customers with a more personal experience.
 Focused on the message
Your goal is to get a message across, not just have a pretty graphic. Piktochart focuses on the message.
 Built for businesses
Canva is great for people who want to share graphics on social media. Piktochart focuses more on business communication.

Templates
With Canva, you only get access to all images, icons, and illustrations if you have a paid account. With Piktochart, you get access to all templates from the get go. No need to get a paid account to try out all the different templates.

Assets
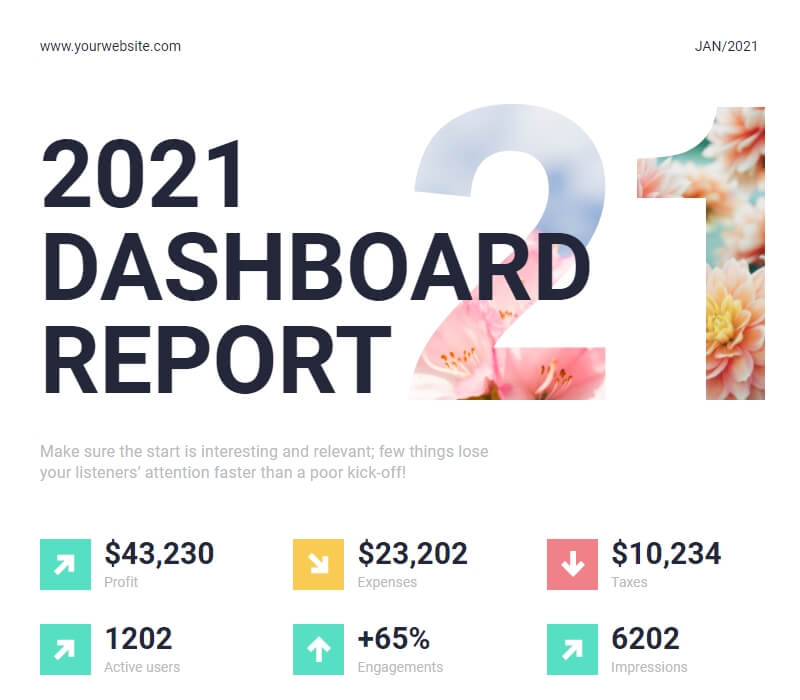
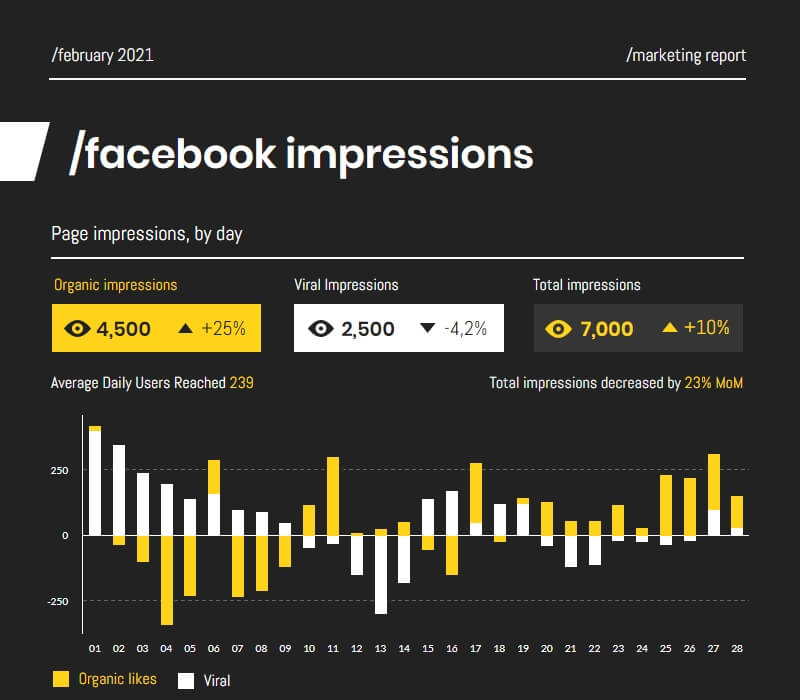
Canva is great if you want to design a wedding invitation yourself. Piktochart, on the other hand, focuses more on the communication that goes on inside a business every day. From reporting on progress, to visualizing standard operating procedures or making a company announcement. Link up a Google sheet to your graphic and display the data in a variety of charts and graphs. Line graphs, bar charts, pie charts… All of them can be customized to your liking.
My favorite is @piktochart – it’s the only tool I pay for every year. Very responsive support, too, the few times I’ve needed it.
— Nancy Watson (she/her) 🧢 (@NancyWTech) January 21, 2020
A3: I am thankful for all google things— and @piktochart. Love making Infographics to visualize, connect and align the work happening in our county and building. #forsythpln
— Jordann Aler (@JordannAler) November 22, 2019
Just used @piktochart for the first time. I like how the layouts make the information easy to read. It was easy to use and I will definitely be using it again! #GEN2108
— Ashley Nelson (@NelsonAshleyJ) November 10, 2019
Our poster turned out really well. I made it using @piktochart and it was crazy simple to do! #EDU19 pic.twitter.com/g1lMB82zBc
— Eric Mosterd (@emosterd) October 16, 2019
Ss produced some great work to start the year using @piktochart! Created travel brochures/infographics on some of the amazing physical features of the US! These projects were so well done & look amazing! Check them out! #EdTech#MakeLearningFun #HistoryTeacher pic.twitter.com/UFDOEwFkDz
— Matt Vosburgh (@Coachy_V) August 19, 2019
Thank you @piktochart for allowing my students to show what they learned in a new exciting way. @VictoriaCurry77 @jenschin @gabEEinDC Love seeing my students create their own infographics that allow me to also track data of understanding. pic.twitter.com/7ZWMGXlblL
— Alyssa Cruz (@alyssacruz5612) December 2, 2019

Branding
With Piktochart’s “brand assets” your content is always on-brand. Simply drag your logo or a screenshot of your website to magically extract the brand colors. Do you want to use your company fonts? All it takes are three clicks to do that. Your custom color palette and uploaded fonts will be added to the editor so that you or your team can easily apply them to any new project.
Try Piktochart for free
Collaboration
Bring your team members into one single location. Share your visual work, your brand assets, and review your peers’ work on the fly. With Piktochart for Teams, everyone’s on the same page. Finally.
Try Piktochart for free
Data Visualization
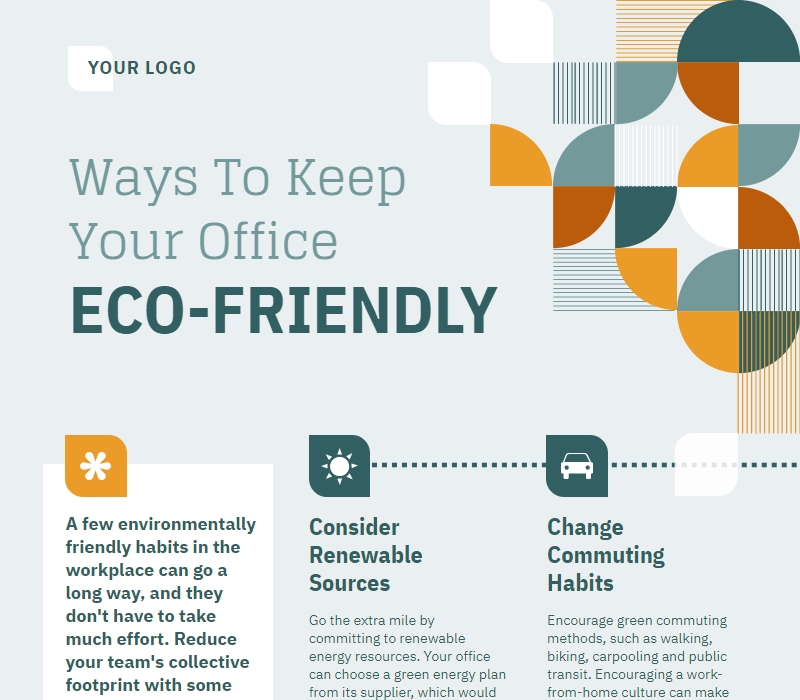
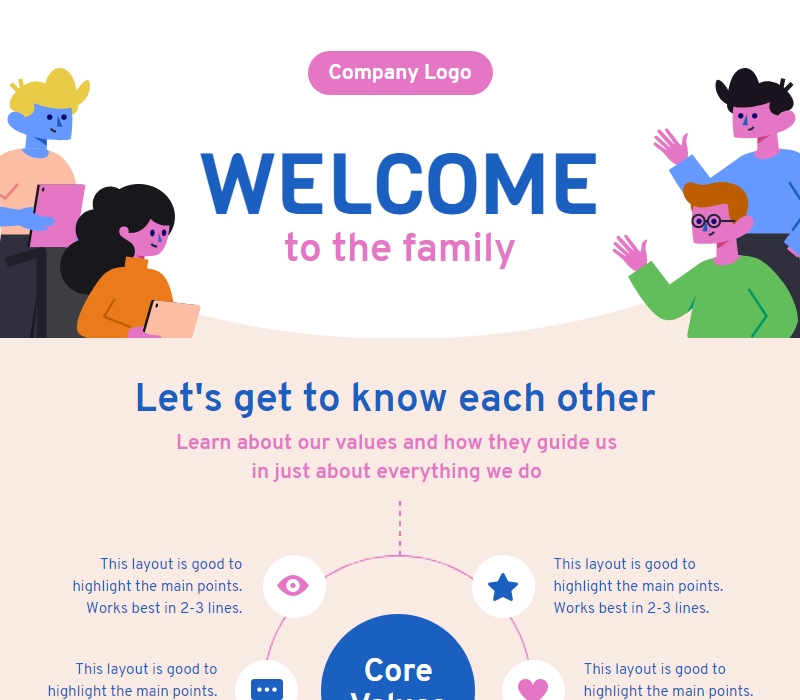
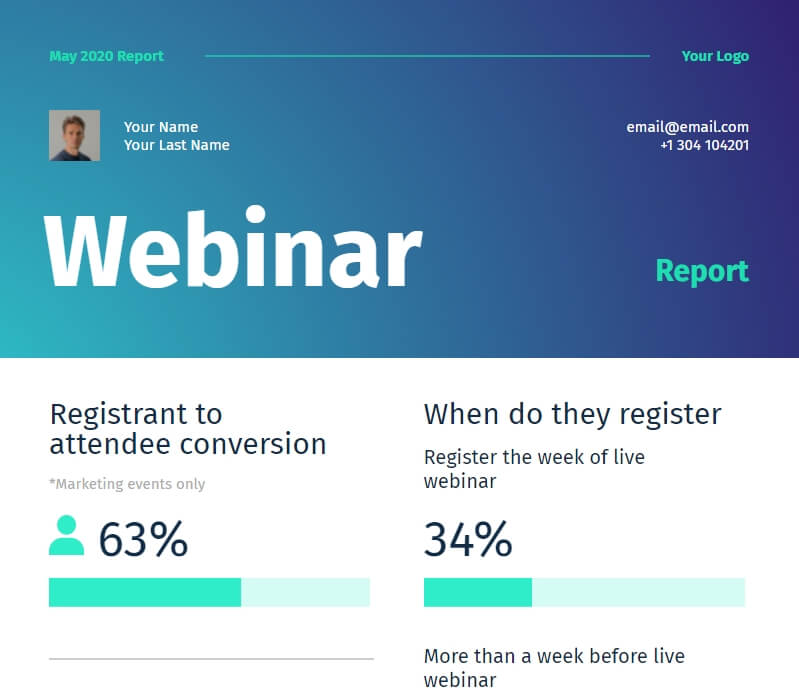
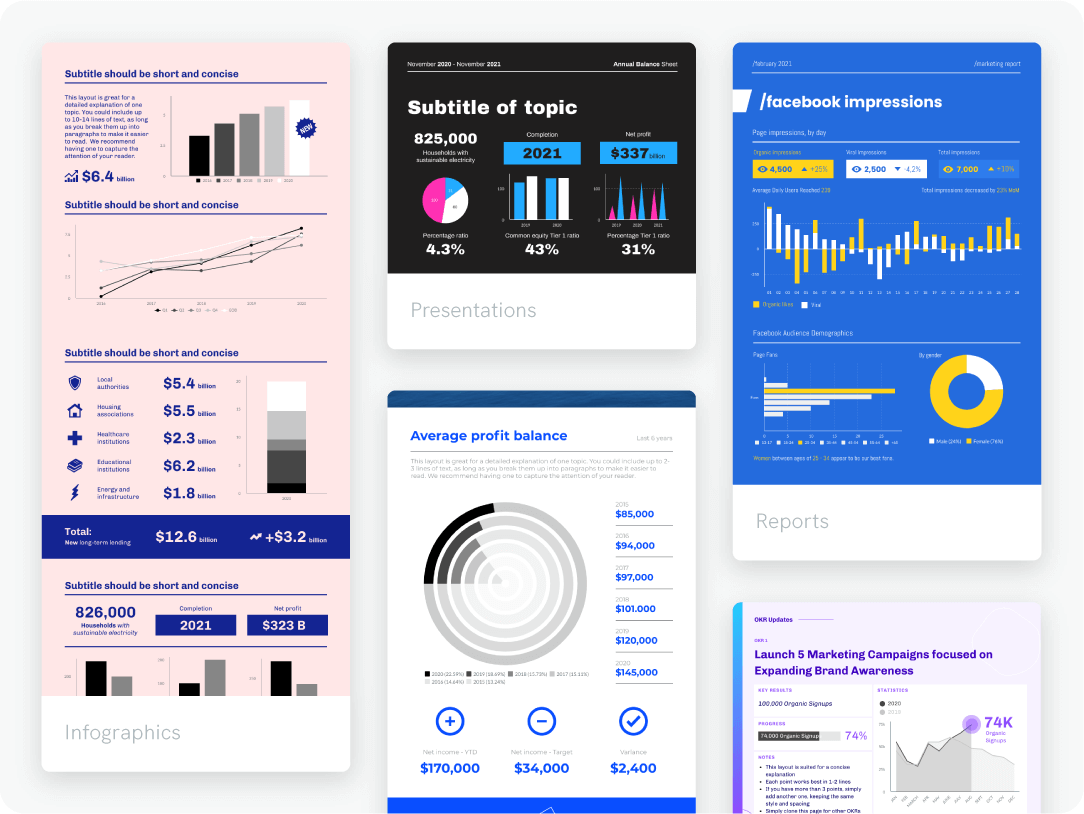
Choose from a library of over 300 infographics, presentations, reports, social media graphics, and print templates designed by visual communication experts. Wherever your ideas take you, you might just get there faster with our ready-made designs.
Try Piktochart for free
Online and offline sharing
Want to share your visual during a video call or a virtual conference? No problem. Easily switch to presentation mode and you are ready to go. You can also download your graphic in .jpg, .png, or .pdf format and share it on social media or offline with your stakeholders.
Try Piktochart for freeAn infographic maker, presentation creator, and report builder in one online platform. No graphic design skills needed.
Sign up for free Watch a demo