Our Online Graph Maker Helps You Create Eye-Popping Graphs in Minutes
Creating graphs that convey a meaningful message is time consuming. Our online graph maker makes it easy by taking care of the design. Just pick a template, add your data, and customize it however you like.
Create a graph for free Watch a demo
Data visualization
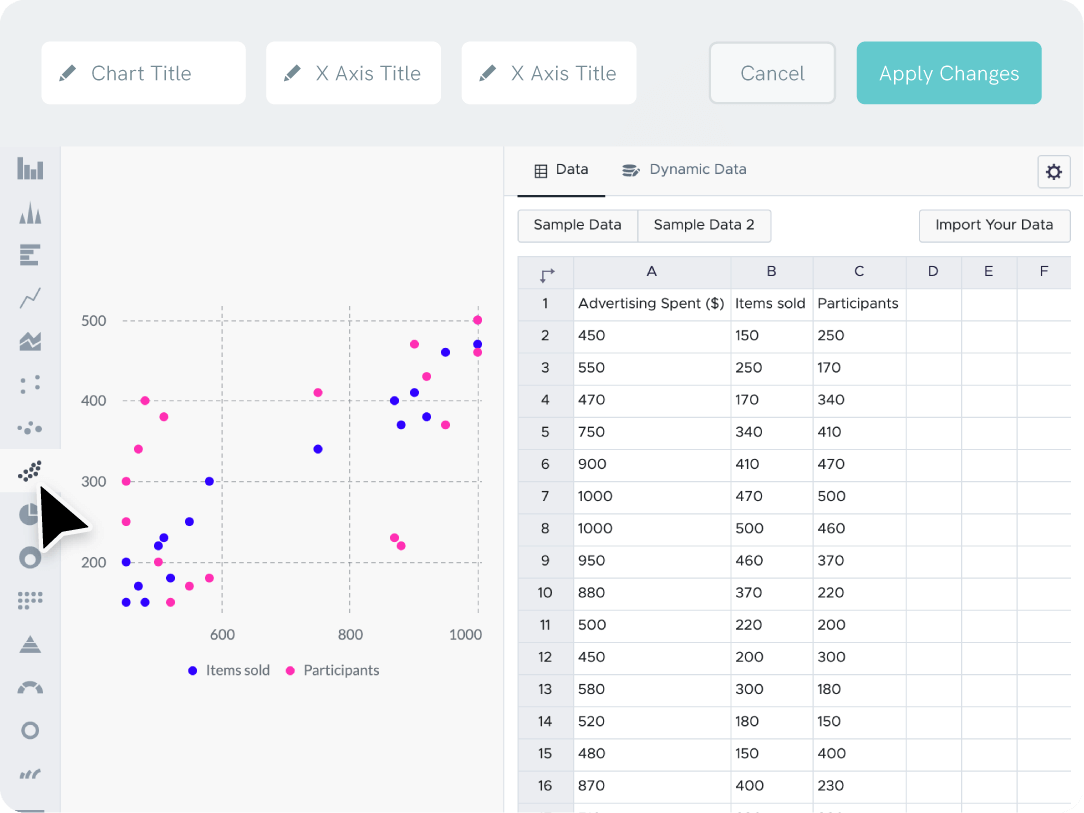
Connect your graph to Google Sheets
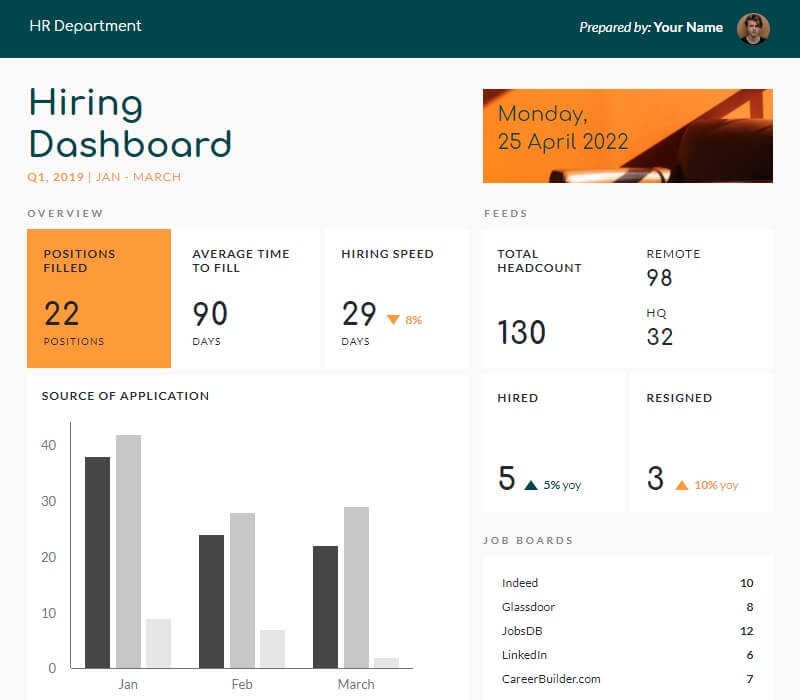
Link your Excel file or Google Sheet to easily create charts that automatically update when your data does. Combine various charts into one page to create a professionally-looking, interactive dashboard, ready to be shared with your stakeholders.
Create a graph
Branding
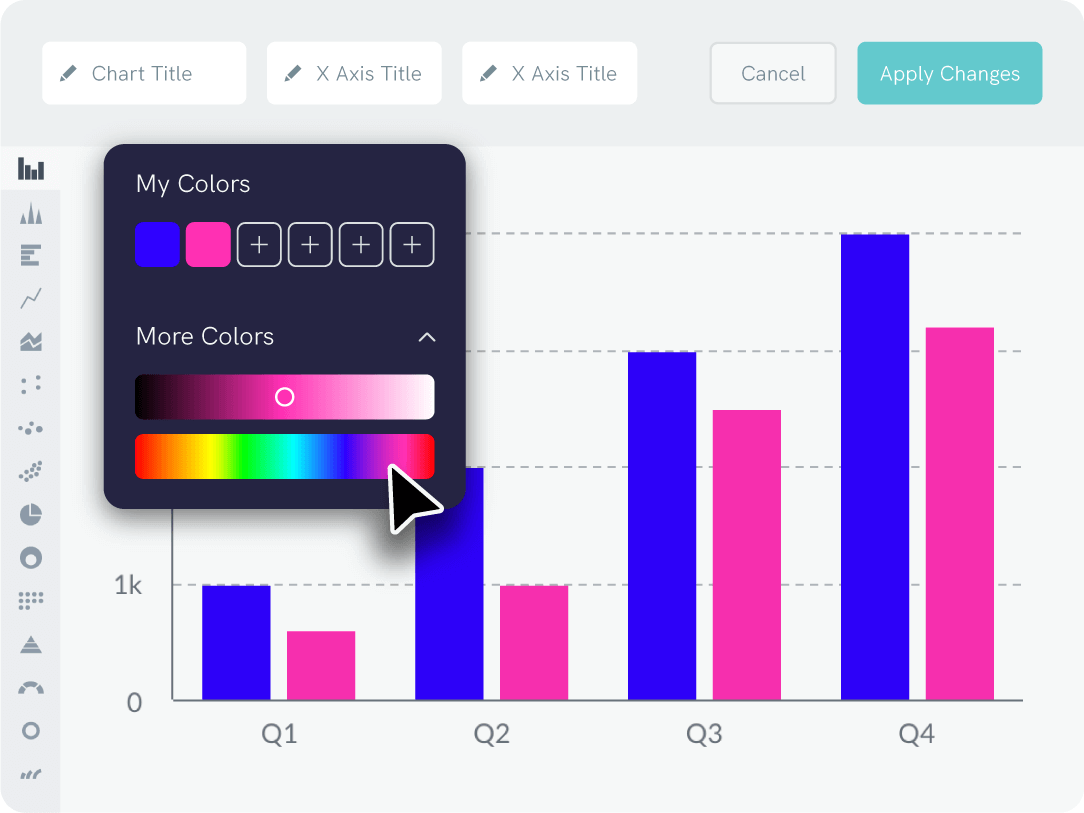
Keep your graphs on-brand
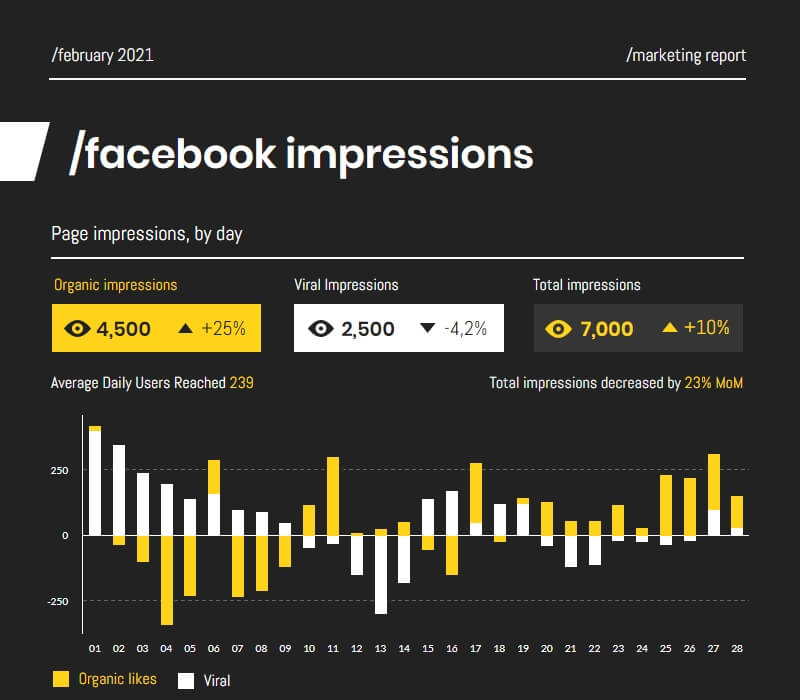
Drag and drop your logo or a screenshot of your website to auto-magically extract your brand colors. Do you want to use your brand fonts? No problem. Your custom color palette and uploaded fonts will always be accessible in the editor. Each graph has a ton of customization options so you can make your graphs look the way you want.
Create a graph
Repurposing
Easily switch between different chart types
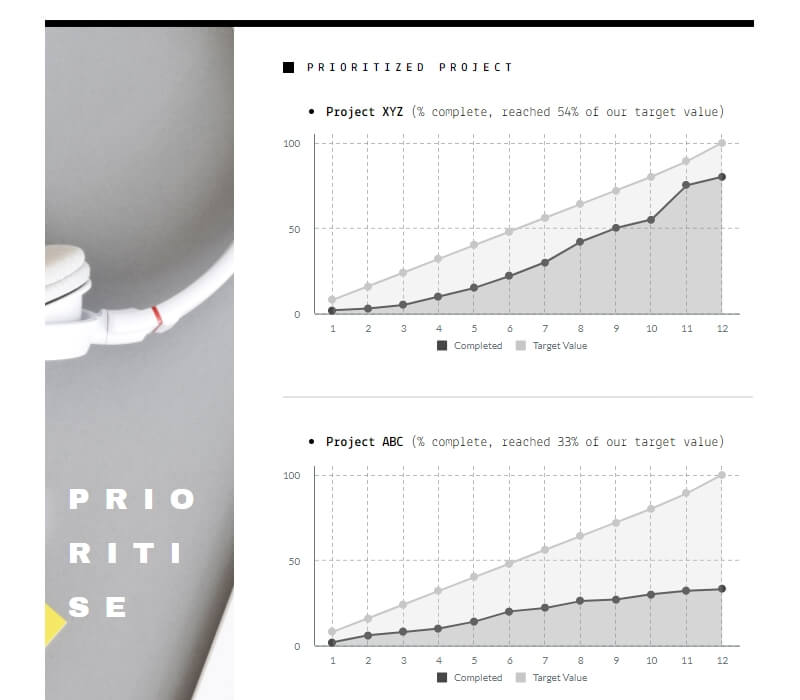
Whether it’s a line chart, a bar chart, a pie chart, or more. Enter your data once and see how your data visualization looks using different charts. If you come back and decide you want to use a different type of chart, you can use our graph maker to change it again.
Create a graph
Content creation
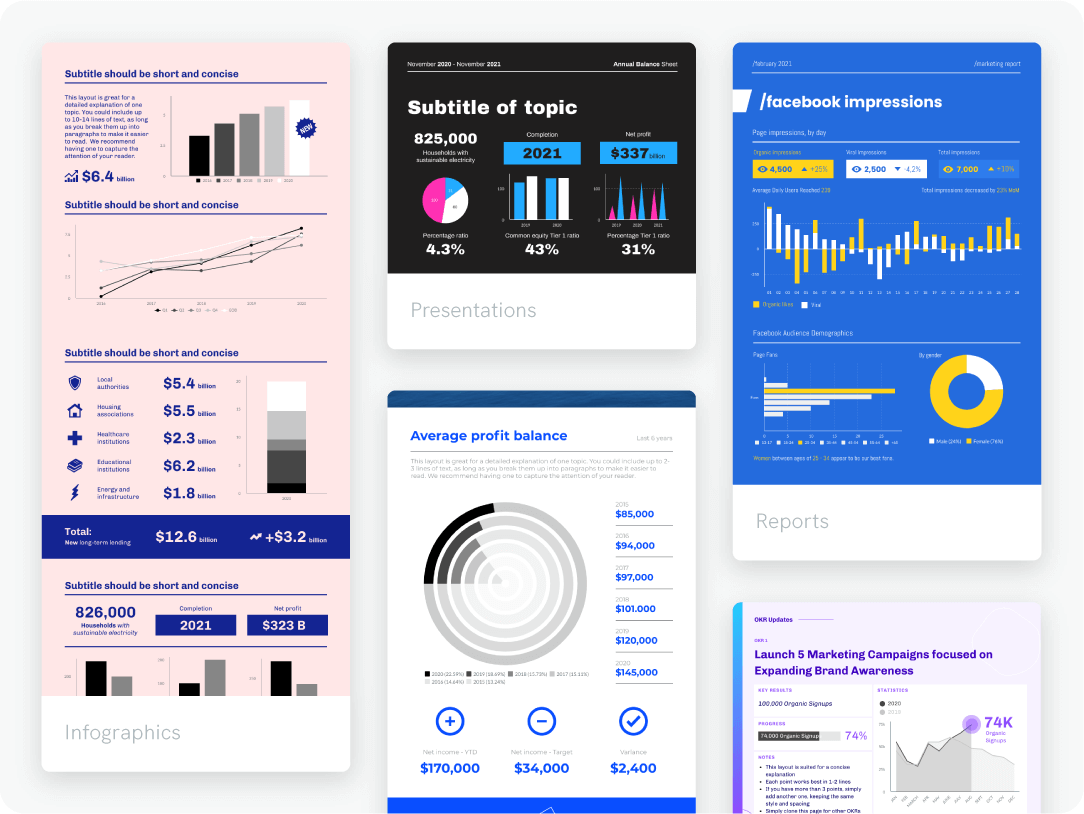
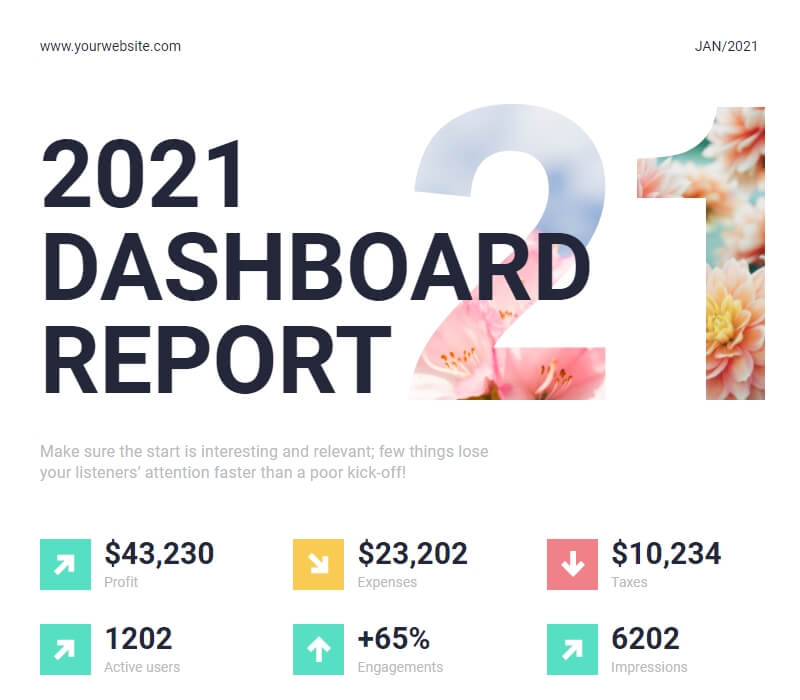
Add your graph to any format
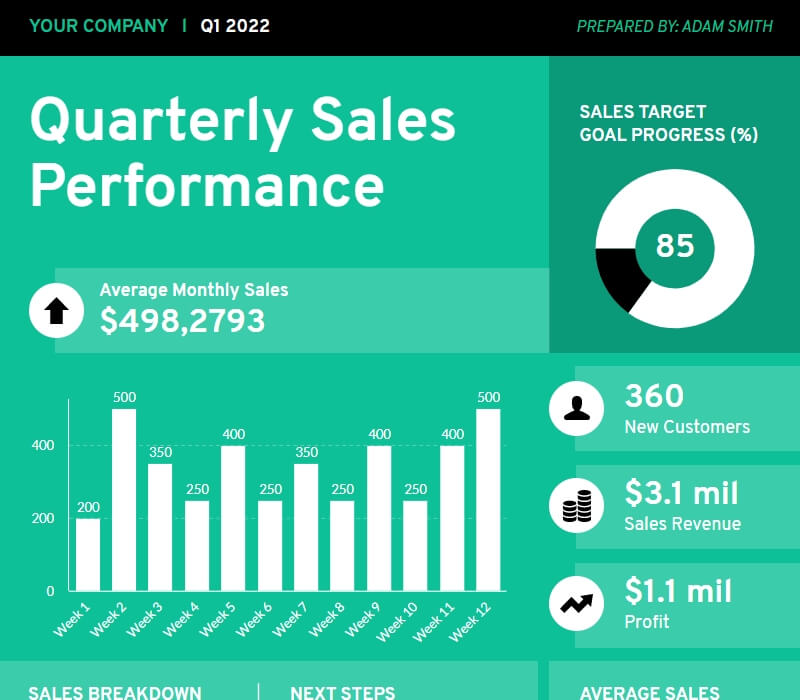
With our online graph creator, you can easily create reports, presentations, infographics (and more) that will impress your peers. Piktochart is so simple that you can immediately use it, without training. Start with a graph template designed by experts or create a graphic from scratch.
Create a graph
Repurposing
Create once, use forever
With a team account, there’s no need to spend hours re-creating the same report every week or month. Organize your templates and past projects in folders. Make it easy for anyone on your team to repurpose content on the fly, ultimately saving their time.
Create a graphTestimonials
“Piktochart is my go-to tool when I’m looking for a way to summarize data that is easy for our upper management to review. Piktochart provides me with the tools to display data in a creative, visually appealing way.”
“Piktochart has allowed me to change the style of my company’s communications. The campaigns are more visual, modern and attractive thanks to the templates that always serve as inspiration. Now even my colleagues use it! Piktochart helped me to engage, increase participation in events, add value to internal campaigns and to reinforce the culture and communication flow of my business.”
“As an HR Assistant, I have to find new and creative ways to engage our employees and effectively communicate across a large organization. Piktochart has tremendously helped me in achieving this.”
“Piktochart helps me translate often dry financial policies and accounting standards to easy to understand and concise one-pager visuals for management.”
How to make a custom chart in 6 easy steps
Create or log into your Piktochart account
Pick a template made by designers or start from scratch
Go to tools and open up our chart maker
Copy-paste your raw data points straight into our graph maker, or upload an excel file or csv file. You can link a Google sheet to have the data update automatically.
Adjust data labels, x-axis, y-axis, graph title, background color, and more
Download your graphic as a jpg, png, pdf file, or share your graphic on social media
Add your custom graphs to any template

Ready to try Piktochart?
An infographic maker, presentation creator, and report builder in one online platform. No graphic design skills needed.
Sign up for free Watch a demo