💯 Learn how to effectively get your message across with the Fundamentals of Visual Storytelling course.

Ease of use
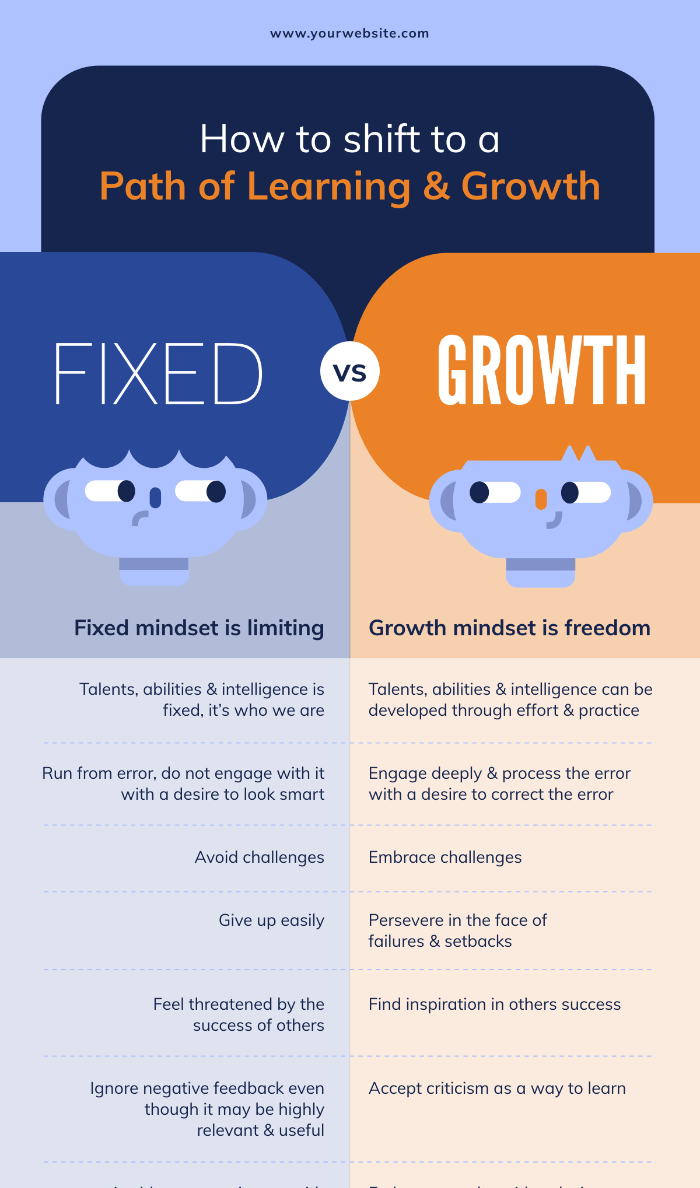
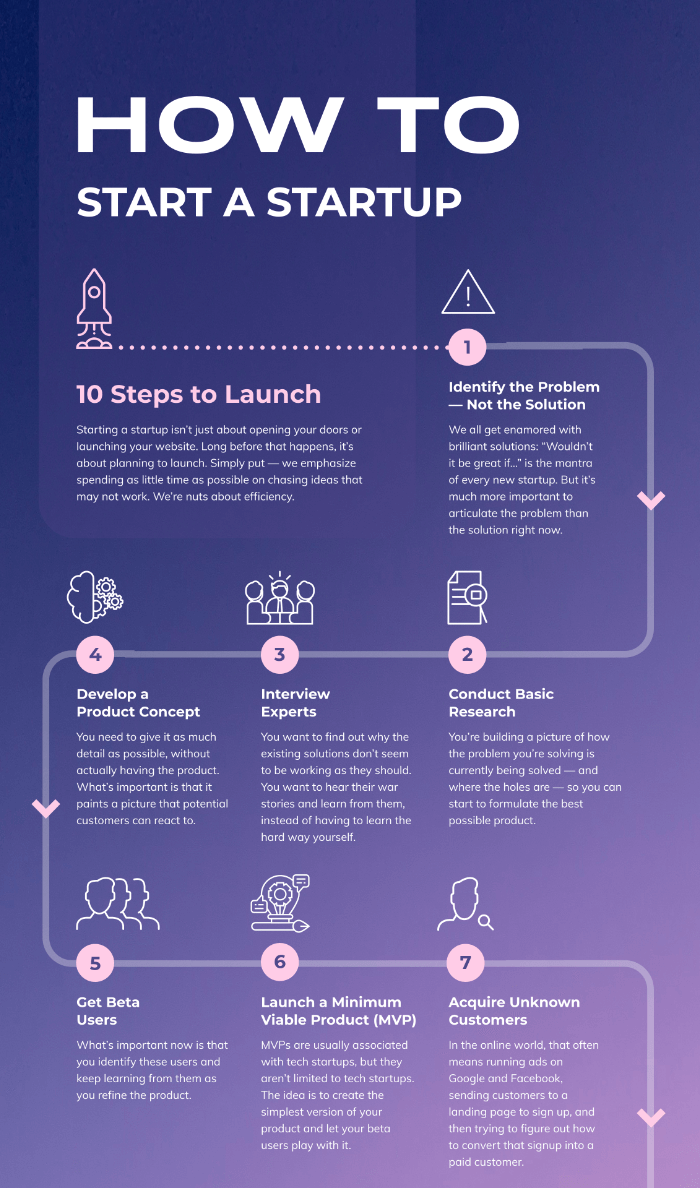
Whether you need to explain a process, show off data, or tell a story, infographics are the perfect tool for the job. Start from a template or create an infographic from scratch. You decide how much control you want.
Get started
Asset library
The times of searching for the perfect image, illustration, or icon are over. With Piktochart’s free library of graphics, designs components, and templates, the visual inspiration you are looking for is there where you need it. Making your content beautiful has never been so easy.
Get started
Branding
With Piktochart’s “brand assets” your content is always on-brand. Simply drag your logo or a screenshot of your website to magically extract the brand colors. Do you want to use your company fonts? All it takes are three clicks to do that. Your custom color palette and uploaded fonts will be added to the editor so that you or your team can easily apply them to any new project.
Get started
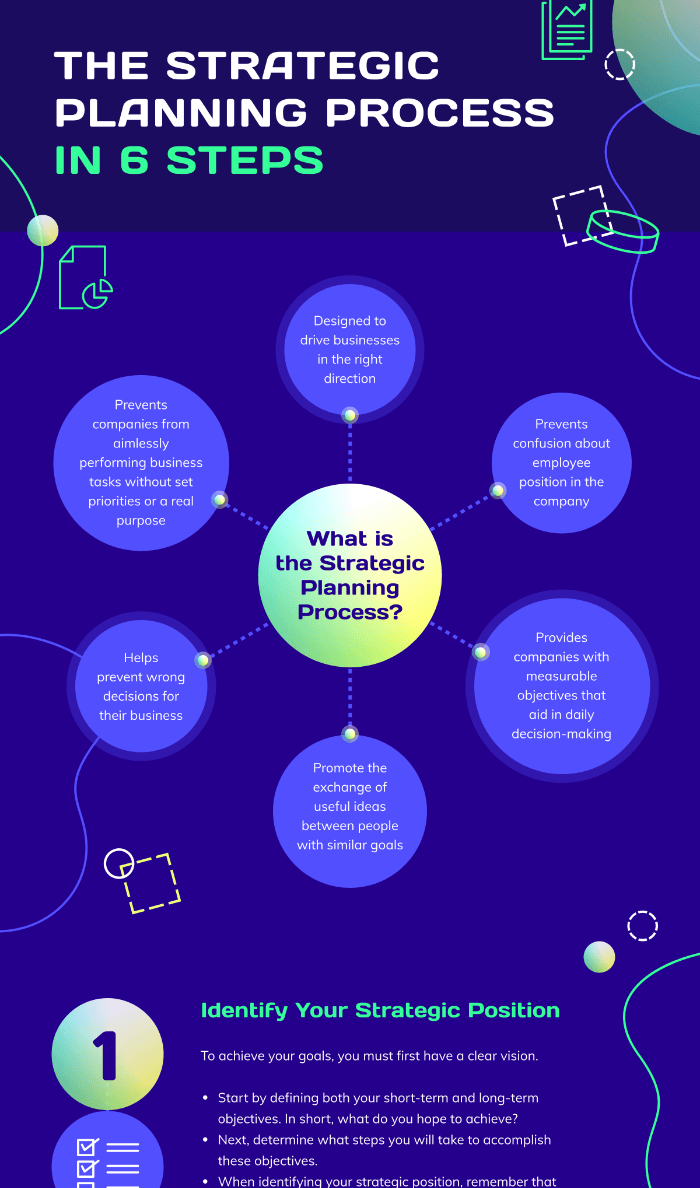
Storytelling
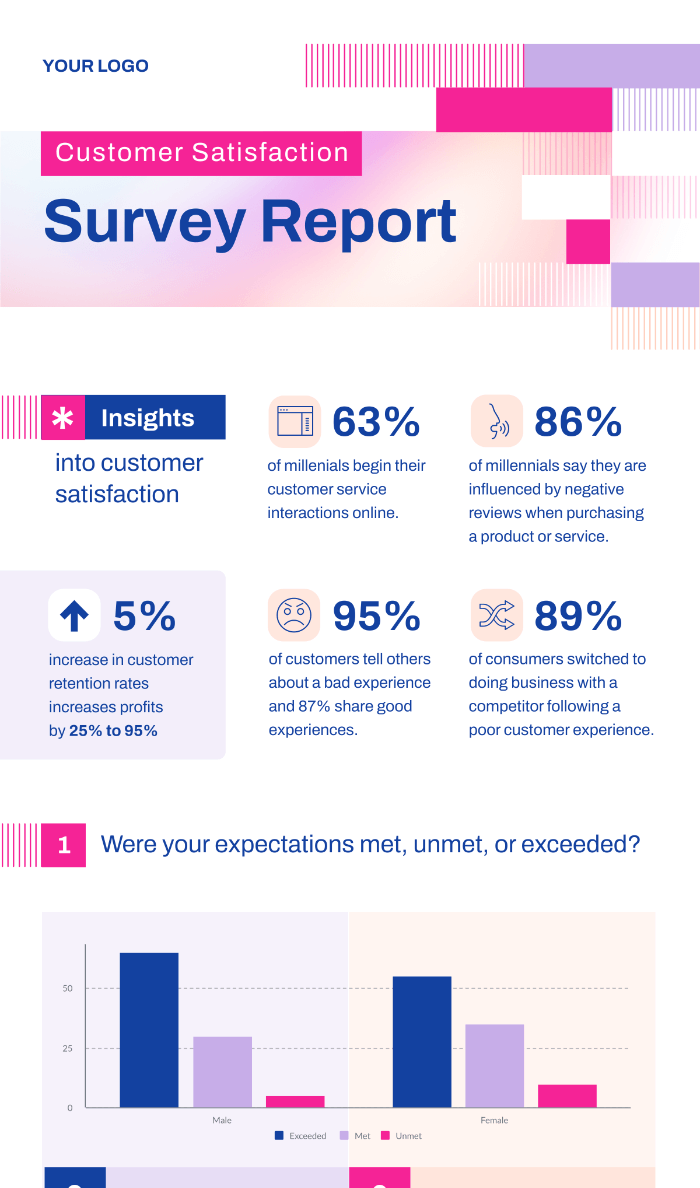
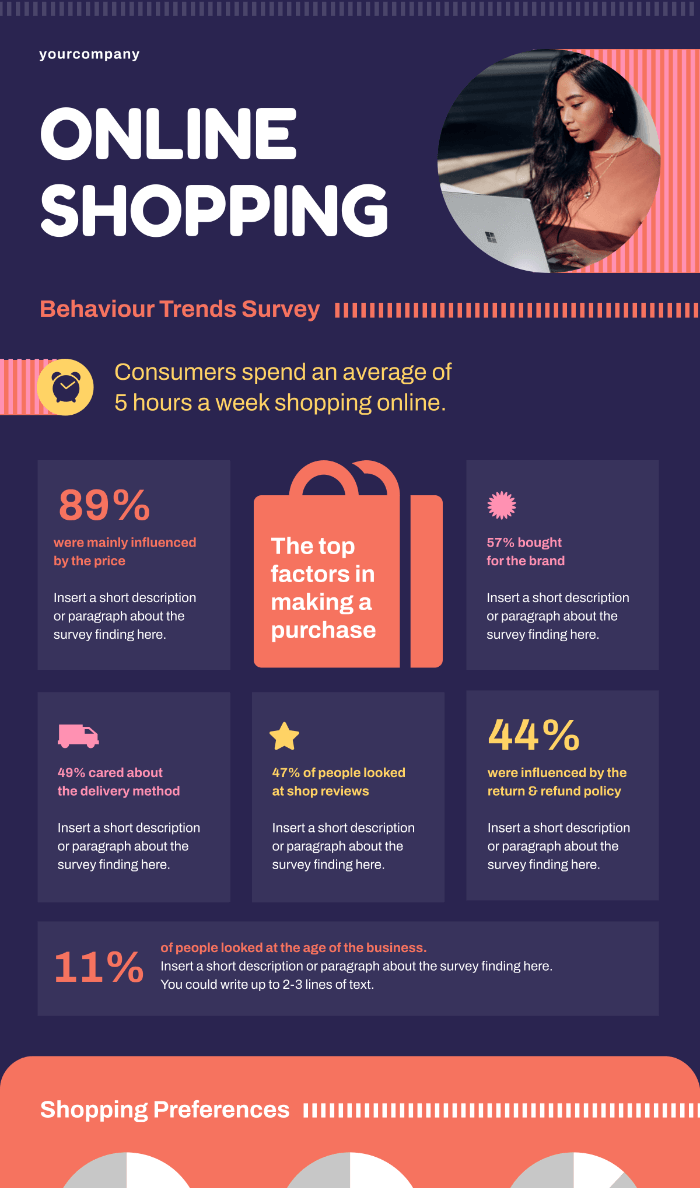
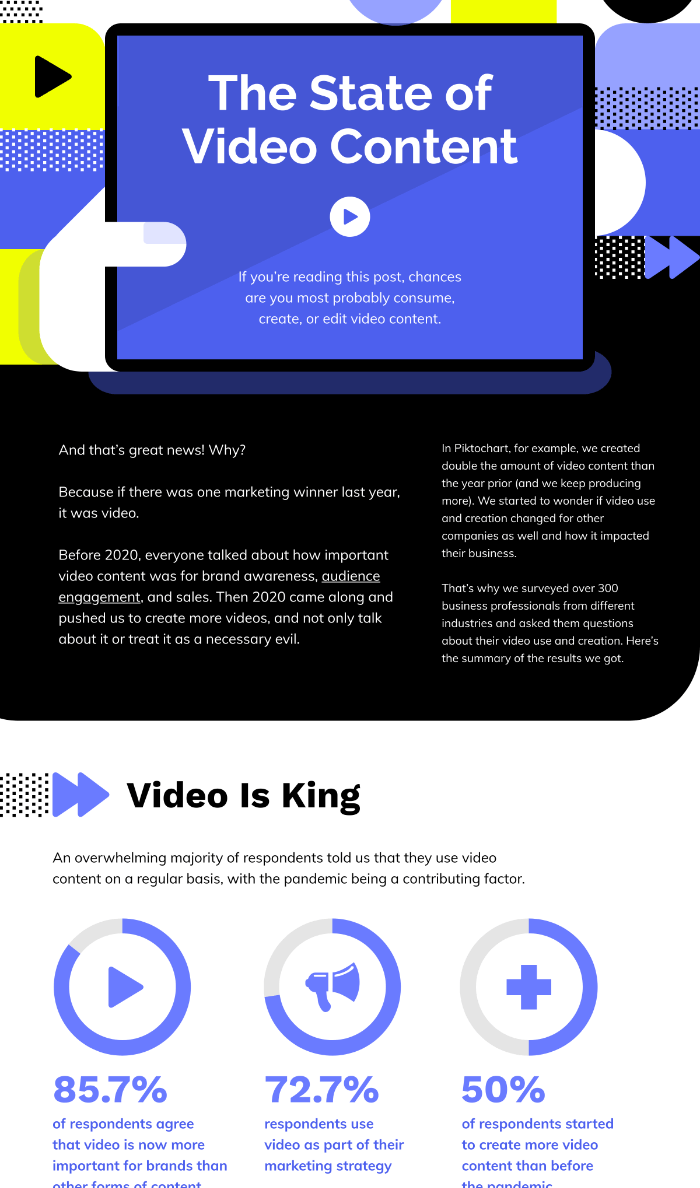
With Piktochart’s robust charts and maps you can quickly translate your data into an infographic that will grasp the attention of your audience. Link up an Excel or Google Sheets file to easily create graphs that automatically update when your data does.
Get started


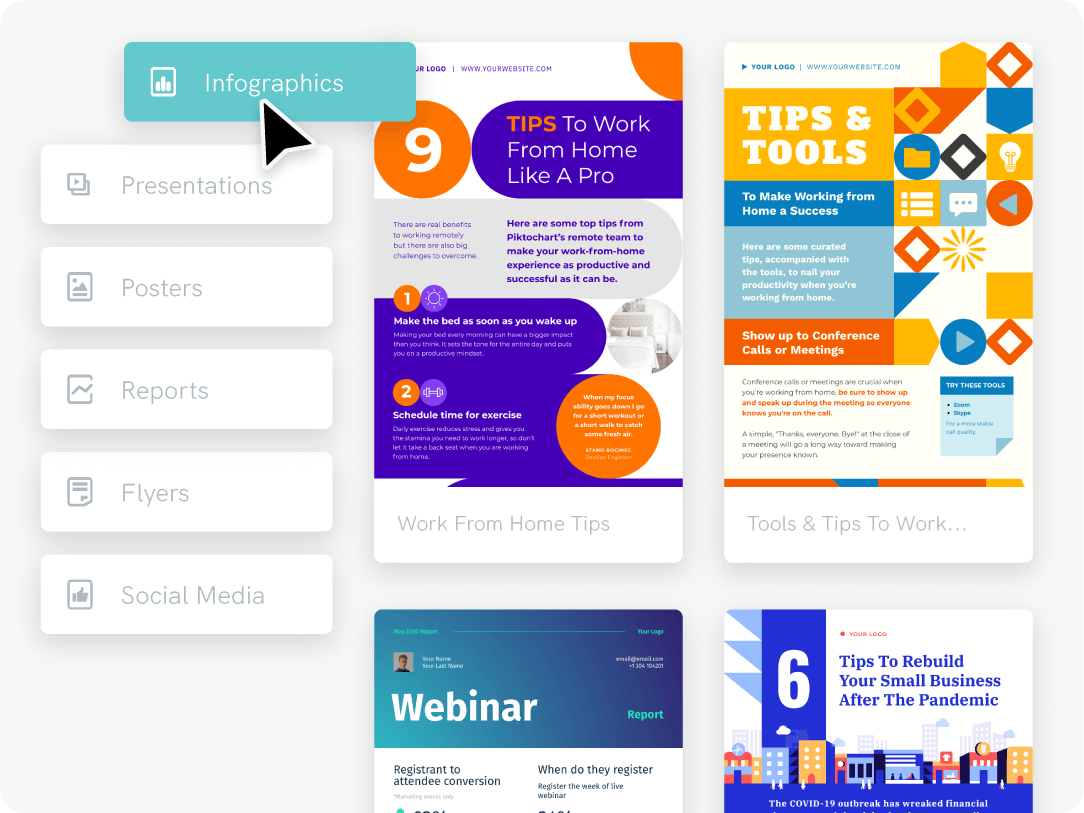
1.Log in to your Piktochart account
Log in to your Piktochart ( or create an account if you don’t have one already) and go to the dashboard. Once you’re on the dashboard, go to the sidebar to the left and click “infographics”.
2.Pick an infographic template
Unless you’re a professional designer, templates are the way to go. Our high-quality templates save you time and make your infographics look as good as they can. Use the search bar at the top to narrow down your search and find the template your looking for.
3.Customize it to your liking
Once you picked a template, adjust the colors, change the fonts, and add in your own text. Add your company’s colors to make your infographic fit your brand.
4.Add images, icons, and other assets
Make your infographics stand out even more by adding images, icons, illustrations, and gifs. Pick from a library of visual assets to create an infographic that stands out.
5.Download and share
Once you’re done customizing your infographic, download it as a JPG, PNG, or PDF. Email it to your colleagues and boss, or embed it on your website for the world to see.

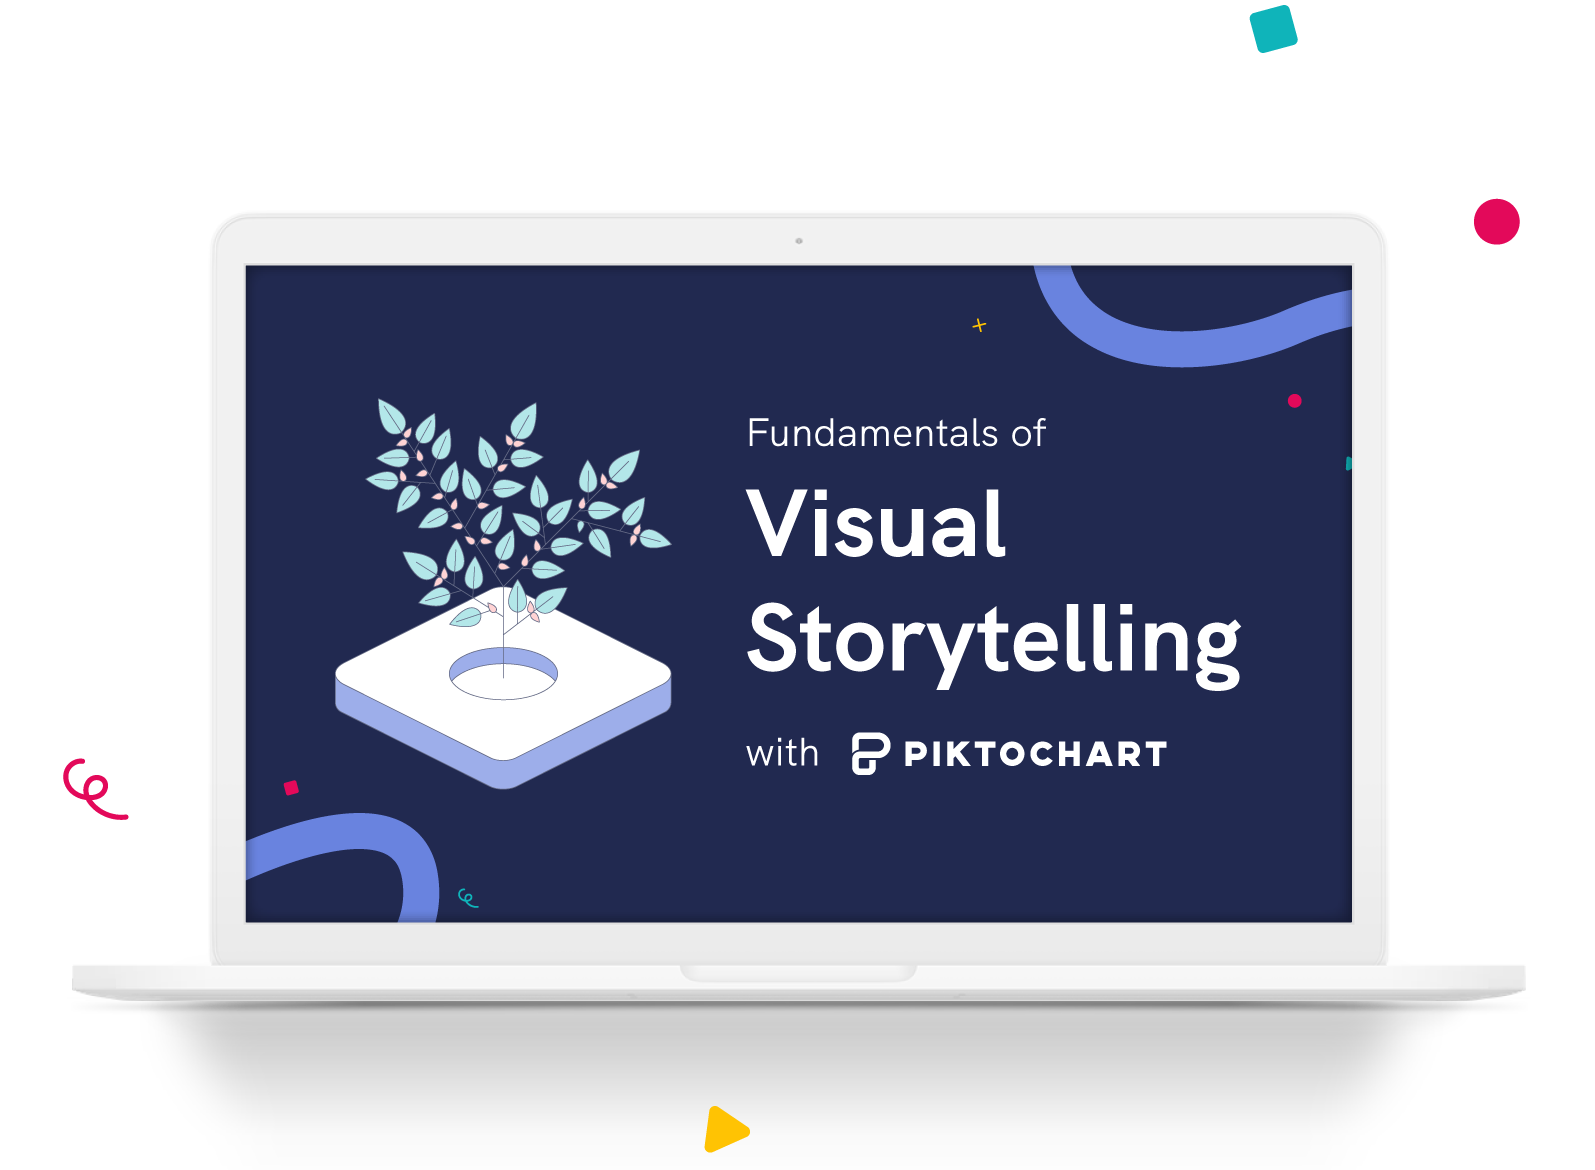
Learn how to effectively get your message across with the “Fundamentals of Visual Storytelling” course. Enroll for free and get certified.
Get startedJoin more than 6 million people who already use Piktochart to craft amazing visual stories.
Get started Watch a demo