Visual content drives engagement. In fact, just one month after the introduction of Facebook timeline for brands, visual content – photos and videos– saw a 65% increase in engagement – Source: Simply Measured
With a number of really great blog articles, tips and tutorials posted out there on daily basis, creating content that stands out and sticks has become challenging to say the least. We’ve already talked about getting to know your main user personas, understanding their challenges and pain points in order to provide them with the content they need and want. But once you do have a piece of blog content you worked so hard on and even offered extra downloadables your customers will appreciate the most, how do you get that content out there and increase its engagement?
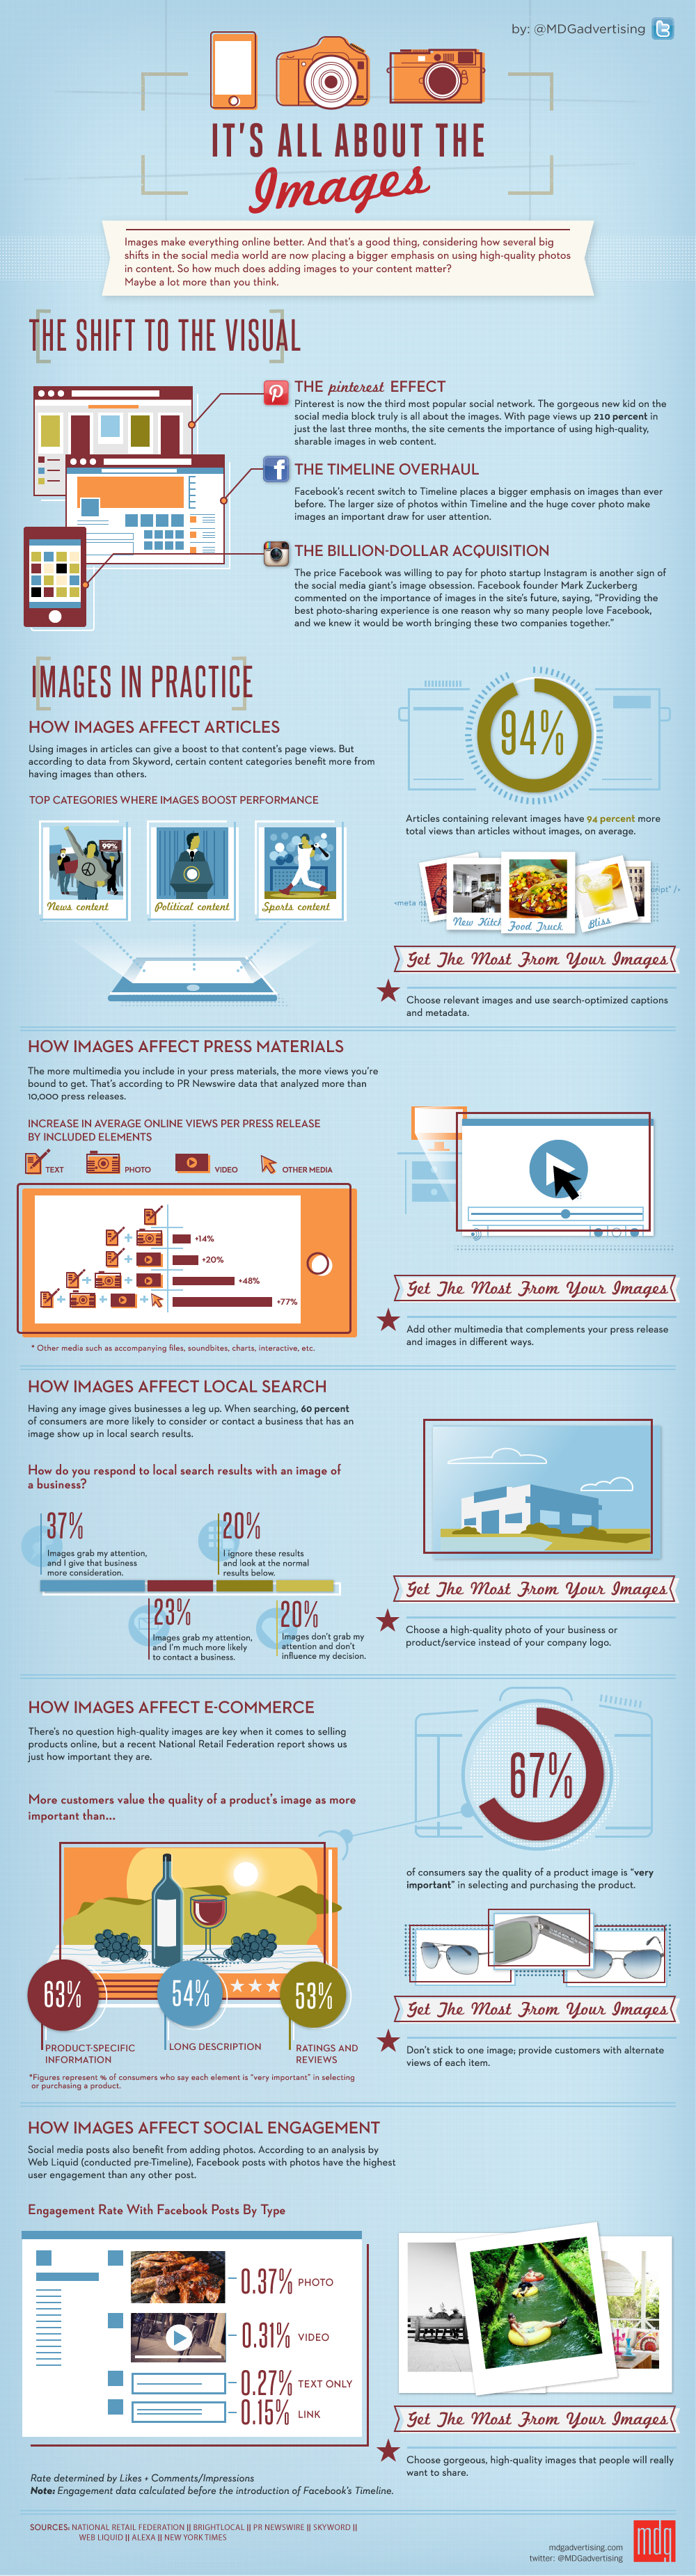
We all know sharing links and text-based tweets are not enough to get readers to your content. That’s where engaging social media visuals come in. According to MDGadvertising, posts or articles with images boost their readership by 94%. We crave visuals and we need bite-size content in order to grasp ideas on the fly. If I cannot get an idea about an article’s main takeaway from a visual, I will not even bother clicking through. Visuals need to convey the message clearly and tease people to want to see more.
So, today we will teach you precisely that – how to engage your audience and make your content more shareable using small, social media visuals.
Let’s start with a few different types of social media visuals you can create in Piktochart for your business. It’s much more that promoting your content! Be it a contest, a promo, event or anything else you need to announce on your social media channels, you can use our platform to create great visuals within minutes. In fact, we use Piktochart just for that on our networks too. Let’s look at some examples!
What You Can Create Small Visuals For
To Promote and Repurpose Your Blog Content
As mentioned above, writing a targeted, useful blogpost that resonates well with your audience and answers their pain points is one task. Another challenge is getting it out there for people to read and engage with. One idea to increase the readability and engagement of your articles is to repurpose the same content in multiple ways emphasizing on main takeaways. This way, people can remember your message better and are more likely to share it. Consider:
- creating teasers for blog articles or series introduction visuals
- creating visuals that highlight different key take aways
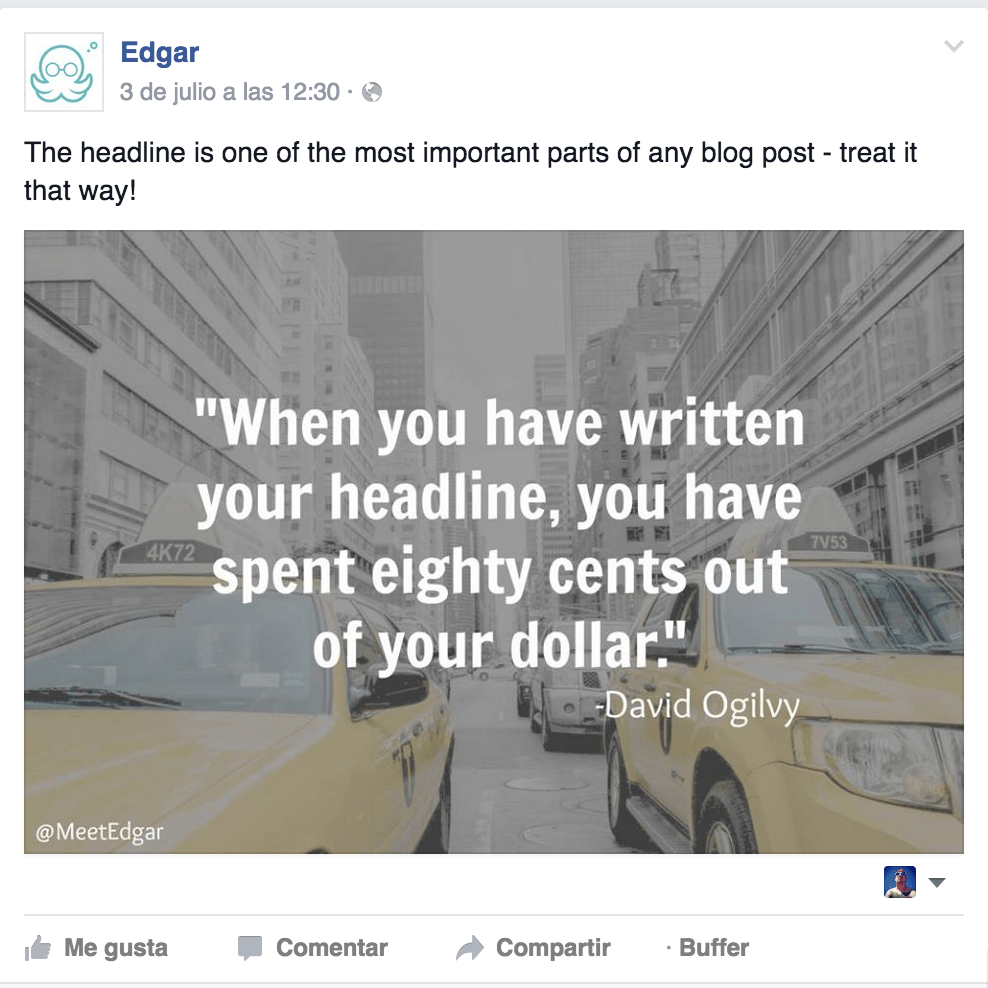
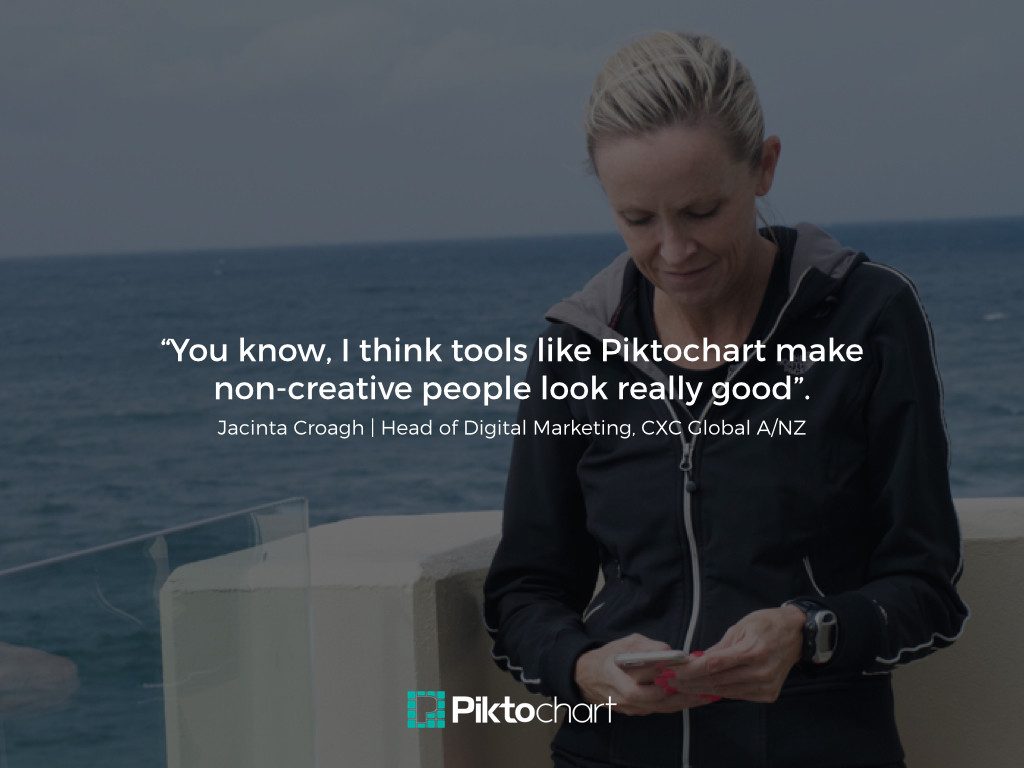
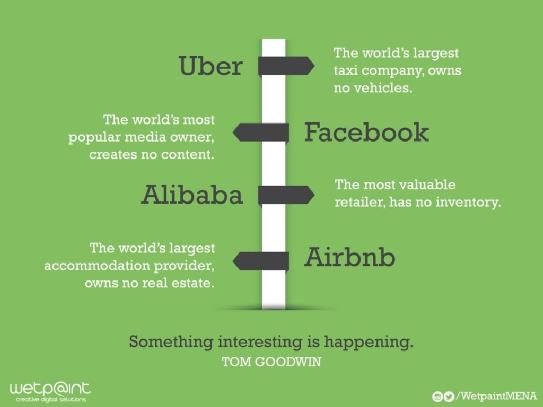
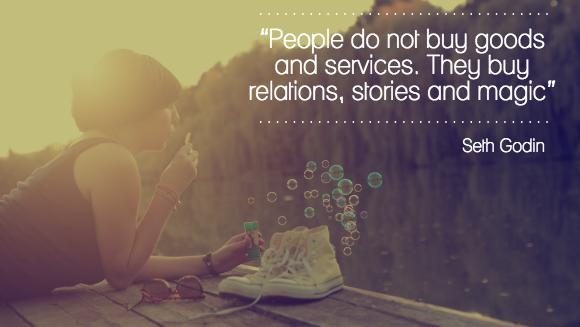
- designing visuals that contain quotes

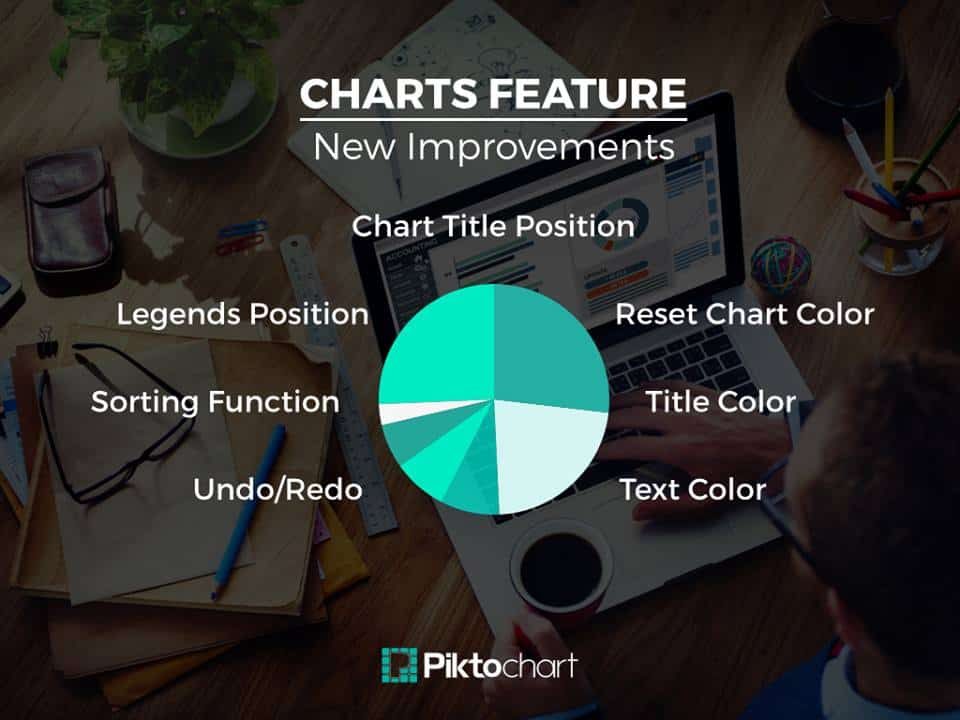
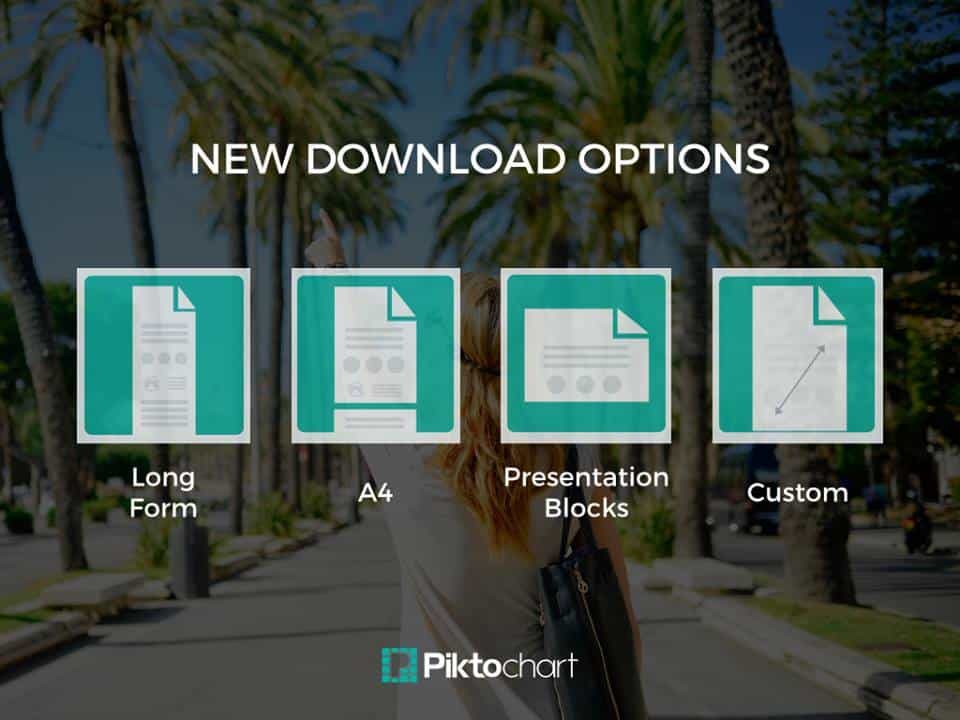
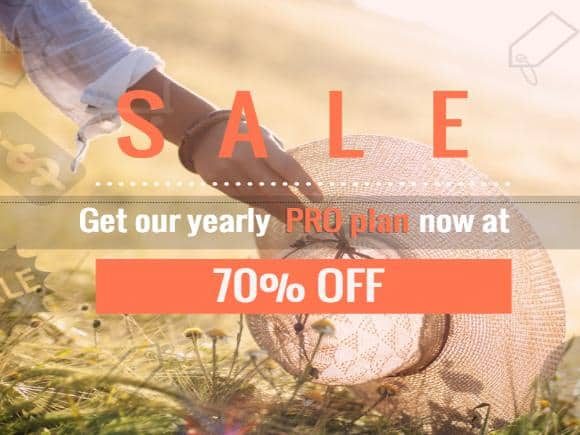
To Promote a Feature or Product Release
Try to summarize your key message in one visual. Without reading your article, people should get a quick grasp of the main idea and know what to expect
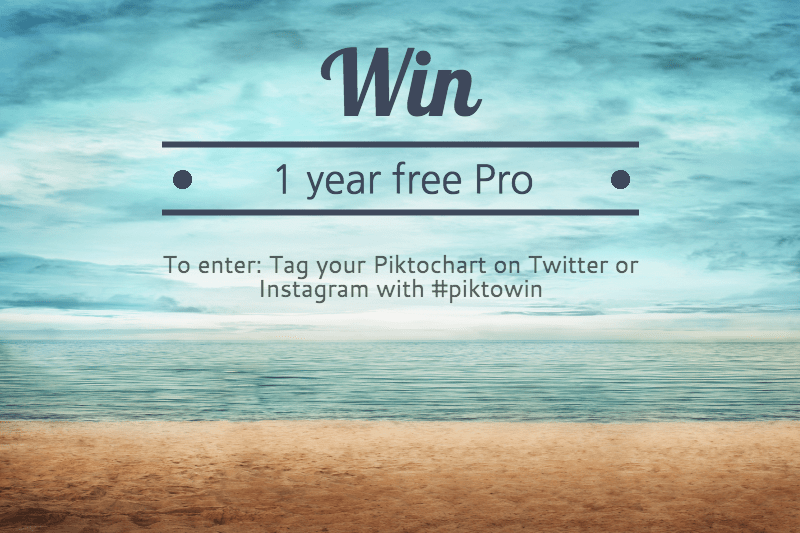
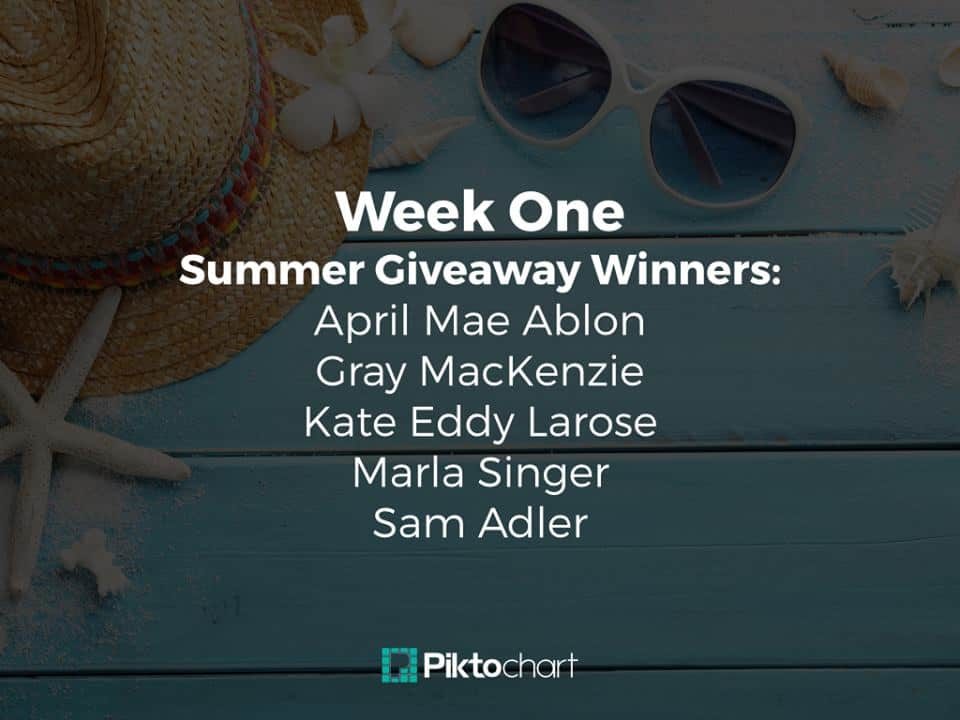
To promote a tutorial, webinar, event, contest, giveaway or a discount
Visuals are great to inform your audience about a tutorial or video you have just released, upcoming webinar or a contest that has just gone live. You want these things to go as viral as possible and beautiful visuals help to spread the word immensely! We created a series of fun visuals for Instagram when promoting our Movember campaign .
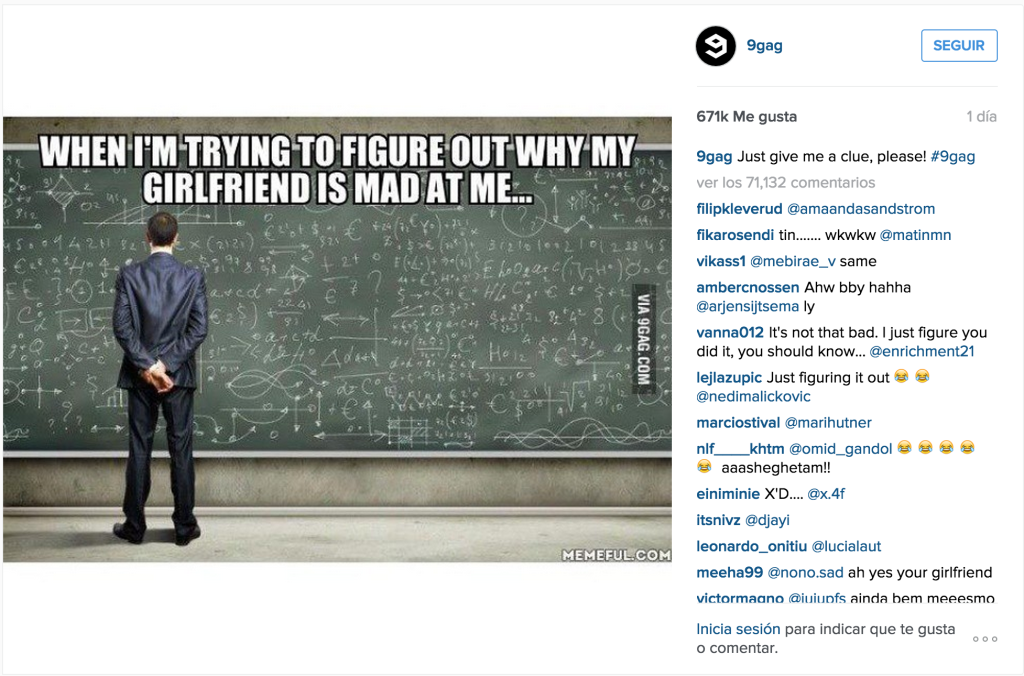
To Share Fun Stuff
It’s not always about business. Providing your audience with fun facts, daily inspirations, memes or interesting stats can only bring you more engagement. People love to share fun stuff more than anything else and if they engage with this kind of content you create, they are more likely to read and share your other articles too.
How to Create Social Media Visuals in Piktochart
So, now that you know what kind of visuals to create, let’s see how you can use Piktochart to create super engaging images in less than 30 minutes
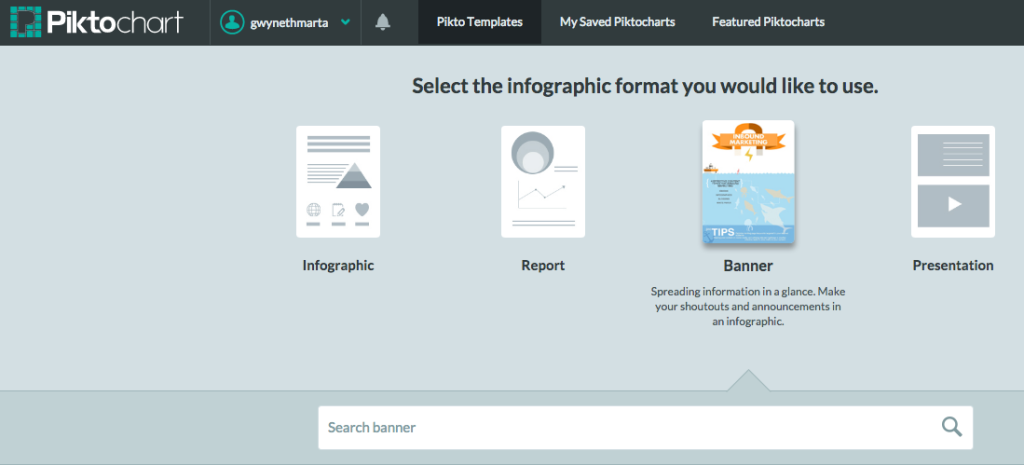
1. Choose the Banner from our Piktochart formats – it’s a one block infographic which size you can easily customize
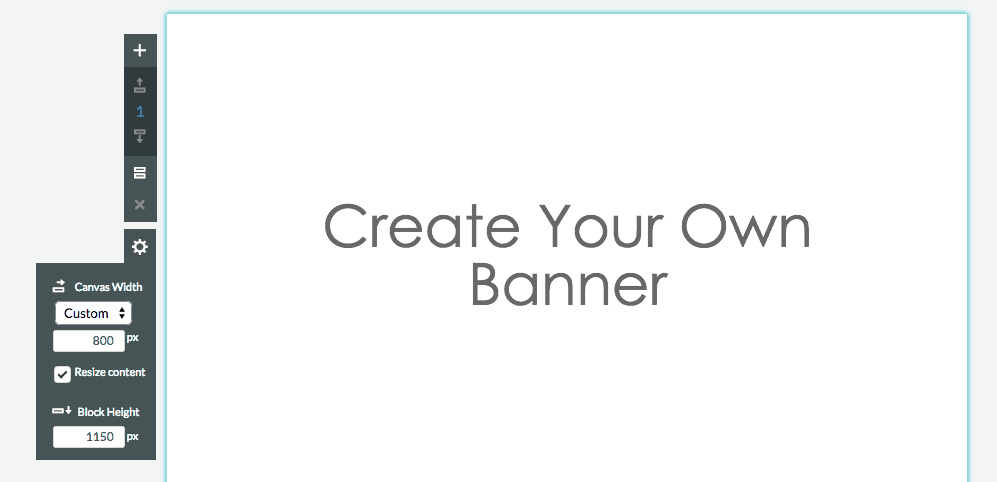
2. Select a template that includes elements or color palette that you would like for your visual or start from scratch using a blank canvas.
3. Resize your banner to the desired format– Here is a very comprehensive guide to social media post sizes by Buffer that explains the ideal sizes of all kinds of posts per social media channel.
4. If it’s an image-based visual:
- choose from our selection of photographs (Graphics – Photos) where you can browse through several categories including Lifestyle, People, Landscape and more OR
- upload your own image – there are many awesome and free photography sites such as http://www.pexels.com/ , http://deathtothestockphoto.com/ or https://pixabay.com/ that you can use to find beautiful imagery (that tends to look less mainstream that typical stock photographs) to go with your message.
5. Add an extra layer to make your text stand out – since we don’t have an image editing toolset available in Piktochart just yet, there’s a small hack you can use in order to make your text stand out better. Here’s how you can do it:
- simply drag and drop a rectangle and change its size to fit your image.
- change its color to either white or black, depending on your image and text color. You can also choose other colors which will produce different effects for your photo.
- play around with your rectangle’s opacity in order to make it more transparent. You can still see the image but it makes your text stand out much more!
6. Add your text – use only 1 or 2 fonts for better consistency. You can play around with their size (bigger size for the header, smaller one for the subheader)
7. Add extra elements – while it’s best to keep your small visual simple, you can also consider adding:
- vertical or horizontal lines to divide your text
- your company logo (its best to use png images with transparent backgrounds)
- icons to support your message – you can choose simple icons from our library and change their opacity so that they don’t steal away the attention from the main elements
8. Save your work, download it as an image and you are done!
Important Things to Keep in Mind When Creating Small Visuals
Now that you know how to create social media visuals, here are some extra tips on how to make them look professional:
1. Keep it simple and try not to overdo it with too many fonts and words – take a look at the latest design trends we gathered for you
2. Try to place your text away from the edges and keep it in the middle, otherwise things tend to get cluttered
3. Choose images and icons that go well with your message and those that paint a better picture than words
4. Consult image sizes for each social media network before starting to design your visual – each channel has their own set of rules so you might need to repurpose and slightly redo the same visual for Facebook, Twitter and Instagram


