I first heard about objectives and key results (OKRs) in 2008.
I have just joined Google as an Account Strategist on the Ads team. It was my first serious job after graduation. I learned some theory about key performance indicator (KPI) when studying economics, but the concept of an OKR was entirely new to me.
I remember when in the first month, my manager asked me to draft personal OKRs. Each employee would add them under their profile in Moma (Google’s intranet). This way, individual goals would become visible to anyone at the company.
As I learned, later on, transparency is a vital aspect of the OKR framework (more on that further in the post).
But I didn’t know about it back then.
“Everyone will see and know what I’m working on?”
I can’t forget how insecure it made me feel.
Years later, I realized that I wasn’t anxious about others seeing my OKRs. I just didn’t know how to write them. I was worried that everyone would notice that I got them all wrong.
Luckily, after some practice and looking at hundreds of OKR examples from other Googlers, writing them became as natural as counting from one to ten.
The fear of drafting the wrong OKRs is long gone. But after talking with many individual contributors and leaders, I know that the struggle is real.
Whether you are working in Marketing, HR, Sales, Customer Support, Product or Finance, there’s a good chance that you might not know how to write an OKR.
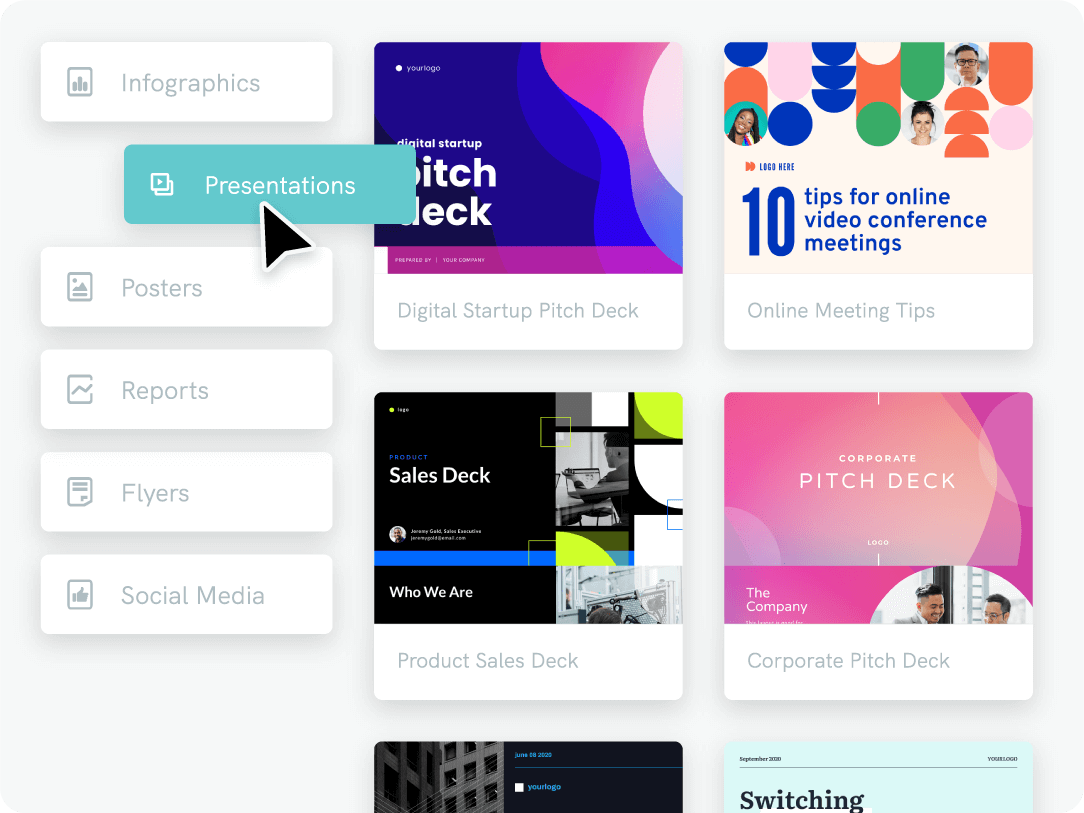
So today, I’m sharing with you the best practices on defining and putting down in writing quarterly objectives and accompanying key results so you can better communicate your goals with your team. We will look at some real OKR examples and ready-to-use templates to make it easier for you to draft your own. And if you’ll need to create a progress report for your OKRs or other professional visuals online, Piktochart offers a free account.
If you don’t have time to read the whole post, feel free to jump directly to the section that you are interested in the most.
What is an OKR and why did this framework become so popular?
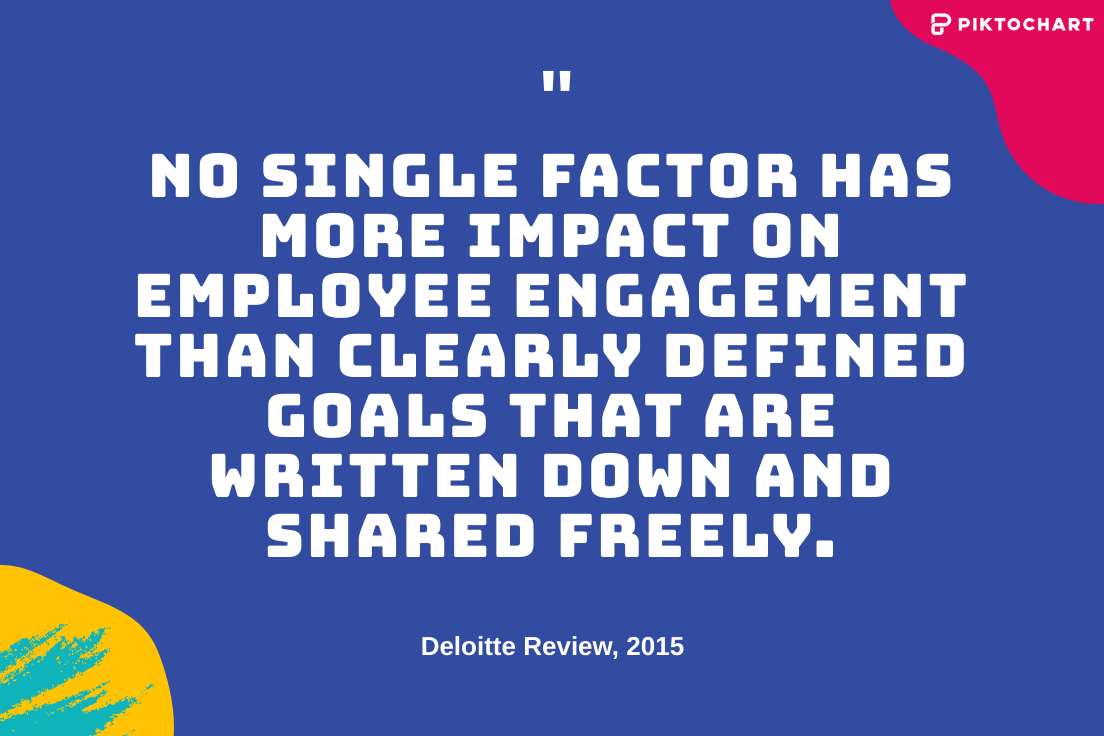
According to the Deloitte Review from 2015, “No single factor has more impact on employee engagement than clearly defined goals that are written down and shared freely”.
Moreover, as published by the American Psychological Association, 90% of the field studies confirm that challenging goals boost performance and productivity.
No wonder some of the world’s top-performing companies such as Google, Netflix, Twitter or Dropbox use OKRs. OKRs have been continuously helping these successful businesses in achieving moonshot-style goals.
But what are OKRs? And how did they become so popular in recent years?
OKR stands for Objectives and Key Result. It’s a collaborative goal-setting framework for companies, teams, and individuals to set challenging, ambitious goals with measurable results.
They work the same when used by a team, a department within the company or the whole organization. They can also work for personal goals and for individuals to get things done at organizations where OKRs aren’t used officially.
OKRs were introduced by Andy Groove who was using them at Intel more than 40 years ago. They started gaining popularity thanks to John Doerr, who has helped Google to implement the framework in 1999. But they first became really well-known and widely-adopted after John Doerr published his 2017 book “Measure What Matters: How Google, Bono, and the Gates Foundation Rock the World with OKRs”.
As described by John Doerr in his book, OKRs help to:
- Plan what individuals within the company are going to produce.
- Track individual and team progress vs plan.
- Coordinate priorities and milestones between people and teams.
- Improve focus on the most important goals; reducing distractions by urgent but less important goals.
- Bring transparency to the company.
- Make achieving ambitious goals possible by breaking them down.
On the whatmatter.com website, you can learn more about how OKRs have helped companies with driving innovation, making their “big hairy audacious goal” (BHAG) possible, and growing a global culture of collaboration. Check out this Ted Talk with John Doerr in which he talks about “why the secret to success is setting the right goals”.
A simple formula for writing a good OKR
Now that we know what OKRs are, let’s move to the most essential part.
How do I write a good OKR?
It won’t be as complex as you might think if you follow this simple formula:
OKR = (Objective = “What”) + 3 x (Key Results = ”Hows”)
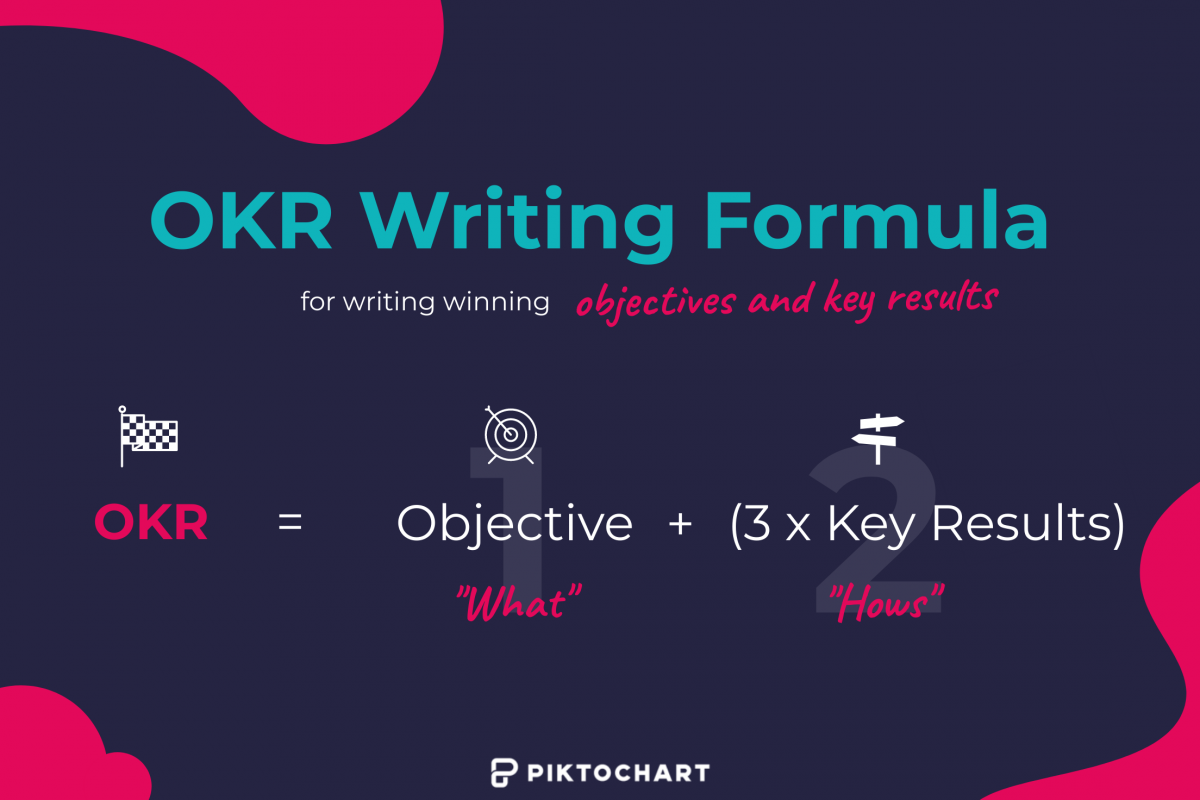
It means that you first define an objective. It is simply a description of “what” is intended to be achieved — an expression of your goal.
When writing your objective, make sure that it meets the following requirements:
- It’s ambitious and inspirational
- It’s concrete
- It’s action-oriented
- It’s not fuzzy
At the end of the quarter is should be obvious to anyone whether an objective has been achieved.
Key results should express measurable milestones that describe “how” the objective can be achieved. Cross-check them against these criteria to make sure they are defined correctly:
- Describe outcomes and not activities. A simple check is to see if your KRs include words like “consult”, “help”, “analyze”, or “participate”,. If yes, then they describe activities. Instead, explain the end-user impact of these activities.
- Are time-bound, aggressive yet realistic
- Are measurable. You either hit a key result, or you don’t. There is no room for doubt. It has to be possible to grade the key result once the target period for achievement has passed.
I usually also recommend not creating too many key results. This helps with prioritization and staying focused on the most critical deliverables. A good practice is trying to limit your key results to just three per objective.
Before and after: turning a so-so OKR into a good one
Let’s now look at how writing OKRs and using the above-discussed formula works in practice. Hopefully, this should make it a bit clearer.
Since I work in marketing, we will assume that I want to grow organic traffic to piktochart.com. Here is my initial OKR:
O: Improve organic traffic to piktochart.com
- KR 1: Publish more blog posts tailored for SEO on a regular basis
- KR 2: Analyze the traffic to existing content to see how it could be optimized
- KR 3: Improve website load-time
This OKR is ok-ish, but it’s missing a few elements that could make it really good.
First of all, the objective is not concrete enough, and it’s not inspirational. How will a satisfactory “improvement” look like and how will it be measured?
The supporting key results aren’t clearly describing outcomes, aren’t time-bound nor measurable. Would the analysis of the traffic to existing content be enough to drive improvements? How can “more” and “on a regular basis” from KR 1 be appropriately quantified and measured?
Taking this under consideration, here is how we could improve this OKR:
O: Drive 5M visitors from organic traffic to piktochart.com in Q4 2019
- KR 1: Publish at least 2 blog posts/week tailored for SEO in Q4
- KR 2: Optimize 10 blog posts with lower traffic for SEO by the end of Q4
- KR 3: Reduce website load-time by 50% as measured with Google PageSpeed Insights
We have made the objective more concrete. We know exactly how much more traffic we are planning to drive and by when we want to achieve it. We have also formulated the key results as measurable milestones which accurately describe the “how”. At the end of the quarter, it will be easy to assess if the OKR has been achieved or not.
OKR examples by organizational function
If you aren’t working in marketing, the previously described OKR might not be that relevant to you. That’s why I have prepared several examples and split them by various organizational functions.
Marketing
O: Increase the number of marketing-qualified leads (MQLs) by 2x quarter-over-quarter
- K1: Generate 500 MQLs from 4 webinars delivered by the end of Q4
- K2: Launch exit-intent popups on the home page and pricing page for first-time visitors who look like they’re about to leave the site.
- K3: 2 lead generation inbound campaigns launched by mid-Q4
Sales
O: Reach 3M in Annual Recurring Revenue (ARR) by the end of Q4 2019
- KR 1: Increase average subscription size to at least $150 per month
- KR 2: Reduce monthly churn from 3% to 1% by the end of Q4 2019
- KR 3: Increase the share of annual subscriptions vs monthly subscriptions to 70%
Finance
O: Increase company’s profitability by 30% year-over-year
- KR 1: Launch PayPal and Google Wallet as new payment methods by the end of Q4 2019
- KR 2: Increase average subscription size to at least $150 per month
- KR 3: Increase gross profit margin from 23% to 54 %
Human Resources
O: Improve internal employee job satisfaction score to 4.5 points
- KR 1: Launch a new internal career growth portal
- KR 2: Interview 20 employees on their needs for improving our work culture and benefits
- KR 3: Develop and present an action plan with 5 improvements for increasing employee satisfaction in 2020
Customer Support
O: Assess overall customer satisfaction by the end of Q4 2019
- KR 1: Get 1,000 responses to annual CSAT survey
- KR 2: Conduct 5 interviews per week with customers and deliver a feedback summary document by the end of Q4 2019
- KR 3: Develop and present an action plan with 10 improvements for increasing customer satisfaction by 20% in 2020
Product
O: Increase user activation rate by 20% by the end of Q4 2019
- KR 1: 100% launched and live onboarding flow optimizations reducing onboarding from 5 to 2 steps
- KR 2: Launch personalized product walk-through mapped to user goals
- KR 3: Launch top 3 most-rated feature requests from the user feedback
Healthcare
O: Increase flu vaccines rate among patients older than 60 by 50% year-over-year
- KR 1: Design, publish, and distribute flu vaccines informational fliers
- KR 2: Produce and launch flu awareness video on the website
- KR 3: Train 100% of staff on flu risks and vaccines and make sure they discuss it during meetings with senior patients
Communication service website, Weekdone, offers a page where you can find many examples of OKRs split by departments and company levels. It should provide you with additional inspiration.
Reporting on progress using effective OKR templates
Now that you have drafted and polished your OKRs, it’s time to make sure that you can effectively use them.
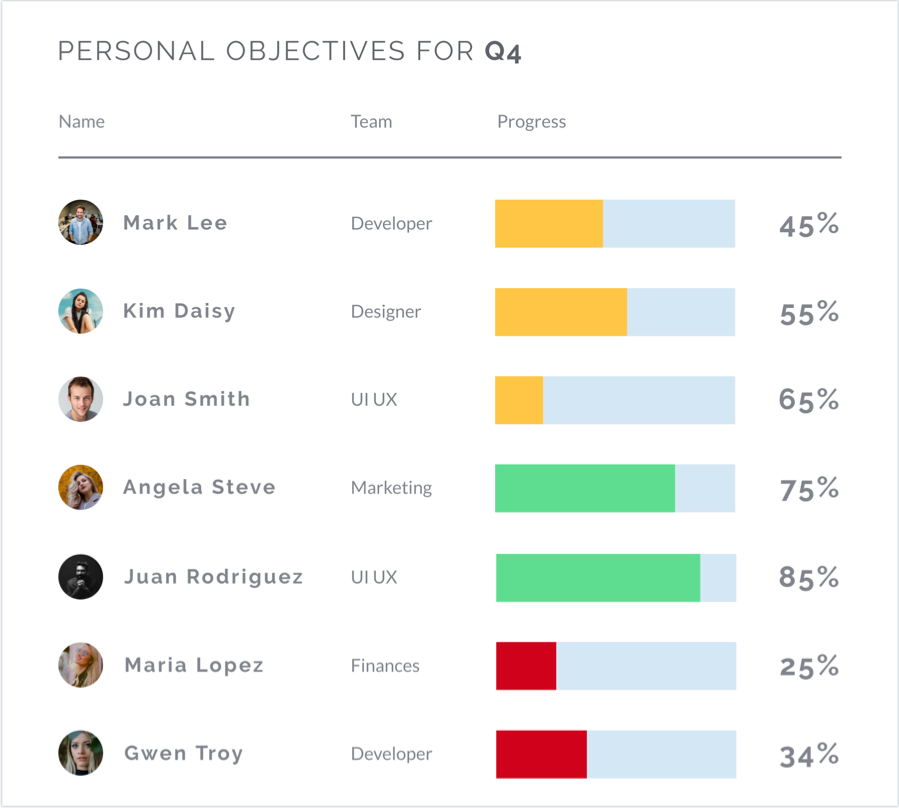
OKRs are pointless unless you regularly check on them. That’s why keeping visual track of your progress and providing an update on the actual achievement of the OKR at least once, towards the end of the quarter, is very important.
At Piktochart, I give an update about the marketing’s team OKRs each month. I present the progress towards quarterly KRs achievement, showcase OKR-related initiatives, and discuss where we stand in terms of our OKRs grading.
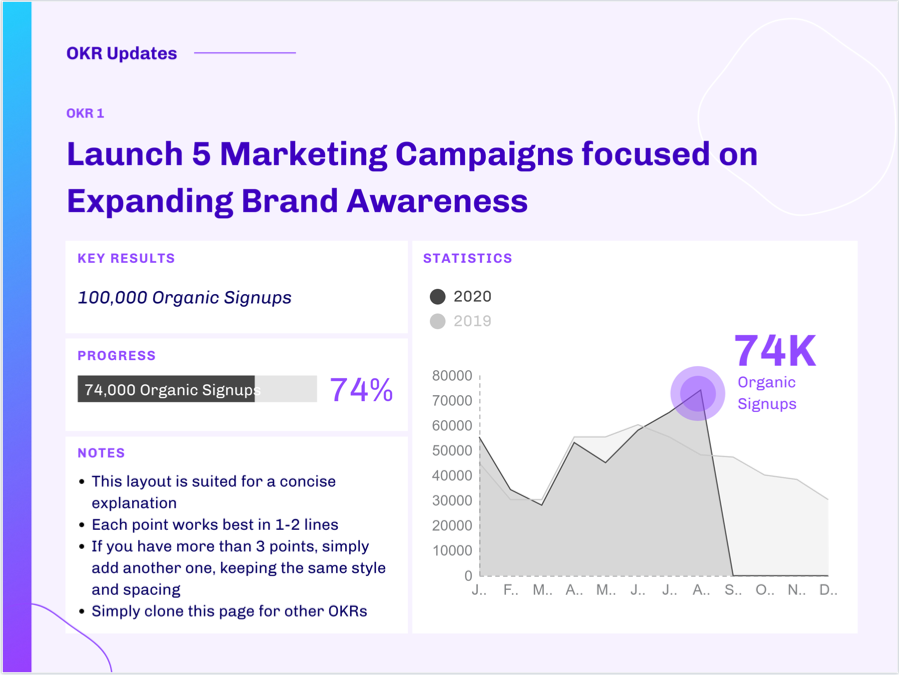
Since I have worked with this framework for a long time, I have collaborated with our Design team at Piktochart on the development of OKR Templates. We have recently launched two of these templates in an infographic and presentation format so that each of you can choose the one that best fits your needs. These templates will help you keep everyone informed on your progress and will make it easier for your stakeholders to understand where you are with your OKRs.
You can access them by clicking on the images below:
I hope that these tips and best practices will support you in becoming an OKR ninja.
OKRs are a great framework that adds gamification to your day-to-day work. They can be both fun as well as motivational. Most of all, they empower people to dream big. And big dreams are what moves us forward.

If you’d like to learn more about OKRs, I spoke at a webinar to uncover more about how to effective use and plan OKRs achieve your organization’s goals.
Show your progress with professional visuals.
Create reports, presentations, or infographics online with Piktochart.
Sign up for free