Oh boy! This year went by so fast.
It feels that just yesterday I was writing “Confessions of a CEO: Piktochart in 2019“, and here we are again, approaching the end of 2020.
To review this year, I decided to follow a similar approach to 2019’s blog post.
But instead of packaging our 12-month journey into the Piktochart acronym, I will try to be more mindful of your time by keeping it short with just PIKTO.
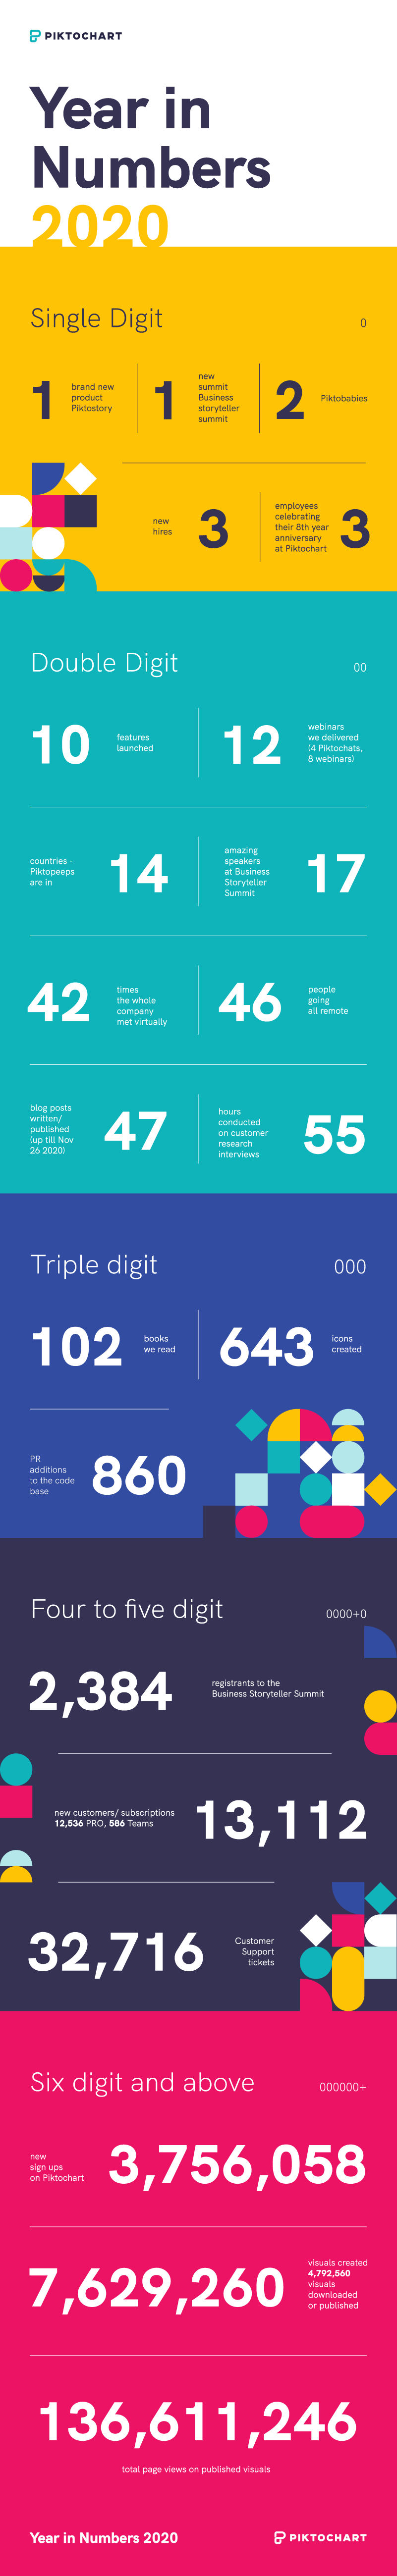
For the ones of you who prefer data over text, we have put together a handy infographic summarizing our year in numbers. You could also create your own infographic by signing up on Piktochart for free.
2020 marks nine years of Piktochart’s existence
I think we can all agree that 2020 was an unusual year.
It will, most of all, stay on my mind as a year of a global pandemic that has taught me to appreciate many things I used to take for granted.
But I will also remember it because it has been a big year for us at Piktochart in many, many ways.
Piktochart has been around for eight years since the launch. Nine years since incorporation. It’s crazy!
Each time I look back, I cannot believe that what started as “I don’t even know if it will be around after one year” turned out to be a company I always wanted to work for. A workplace where people feel happy about Mondays and a provider of solutions that support customers with their visual content needs for nine years and counting.
Progress
In 2020, Piktochart has made a lot of progress towards the aspirational goal we have set for ourselves.
To give you some context, Piktochart started as an infographic tool.
Later we expanded to all kinds of other visual content formats, including presentations and reports.
Now it was time for the next step.
In 2019, we came across a study by Loup Ventures — a VC that has invested in several research-backed reports.
In “Defining the Future of Human Information Consumption,” Loup Ventures explains how we are increasingly spending our time consuming information. So much so that we’ve reached a point of near-saturation. Citing from the article, “we consume almost 90x more information in terms of bits today than we did in 1940 and 4x more than we did less than twenty years ago.”
Let’s take me as an example.
From the moment I’m awake, I’m either listening to a song or reading something. Even if it’s just a billboard, I see while commuting.
At work, I’m in meetings, often looking at presentations. Then I’m reading or writing on my laptop.
In the evening, I go through some books or online articles.
It feels like my information consumption never ends.
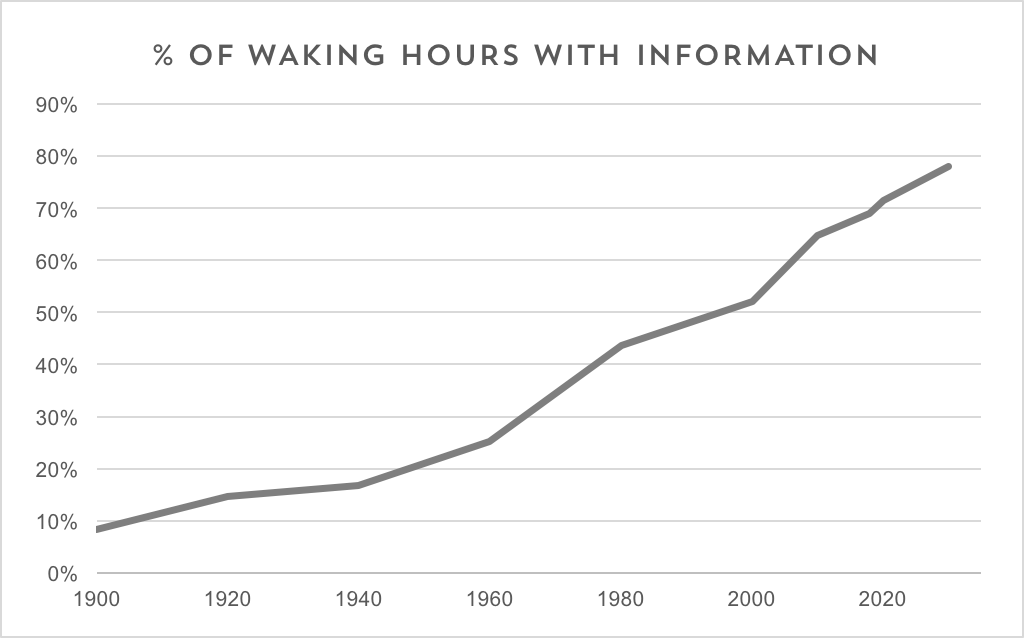
But what makes it even more painful is that we are creating so much information that it becomes impossible to keep up.
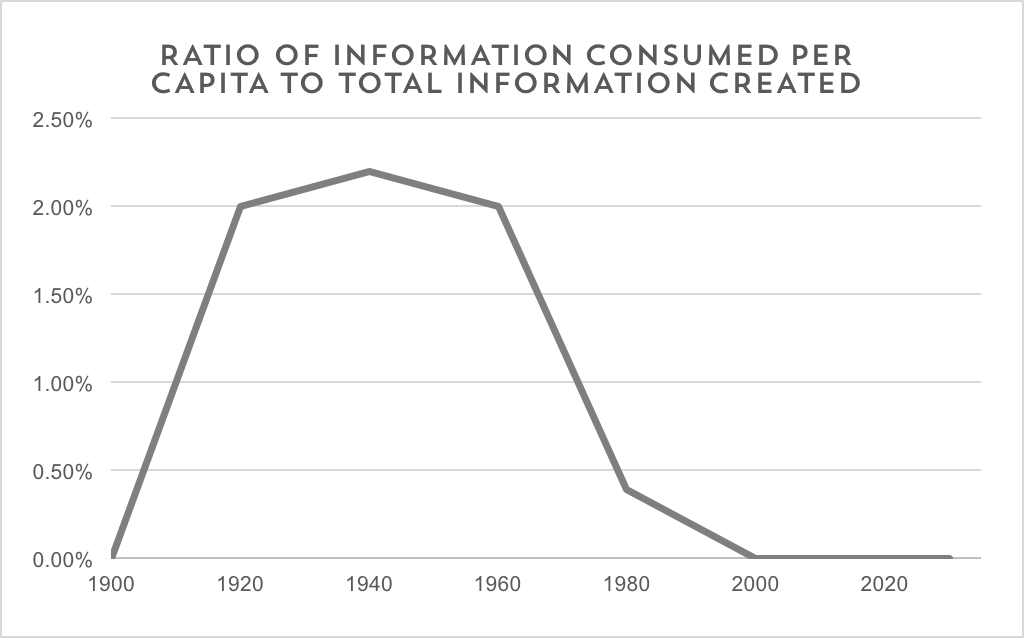
You can see this in the chart above.
With us reaching our limits in both creation and consumption, we are now exiting the Information Age and moving towards the Experiential Age.
This means an increased demand for information with greater relevance, density, and usefulness.
The goal is not to try to cram in more information. It becomes all about trying to get as much meaning and valuable information across in the shortest time possible.
To be clear. We are not affiliated with Loup Ventures.
It’s just that their research really resonated with us.
It made us think.
We knew that visuals are easier to consume than any text content.
But how could we make translating text- or data-heavy content into meaning even more straightforward?
The answer was: visual story. (Initially, bracketed to only infographics)
Piktochart’s roots lie in storytelling, and this is our differentiator.
That’s why instead of focusing on the design, we want to focus more on the story.
The content needs to come first.
Today, Piktochart’s latest innovation is still under wraps.
If you would like to see what we’re up to, we are continually recruiting users to speak with. You’re welcome to become a user by creating an account for free.
We do these tests almost weekly now and we would be very grateful if you would like to be part of one. You can sign up here.
Intentional
In Dec 2019, our head of Marketing, Agata, asked me to think about one word as a hope/wish for 2020.
The word I thought about was “Intentional.” I wanted to learn to be intentional with the time/effort/words/actions that I am taking.
I believe in living life backward. It means having a goal and the outcome on my mind first and then working backward to ensure that that goal is achieved. This can apply to any area of life: business, family, or personal growth.
This year, I have learned to be intentional in the way I spend my time. For Pikto, there are three areas that I was deliberate about:
- Purpose: Learning and continuously improving
- People: Do not glorify hustle
- Profit: Bootstrapped. Which means we need to learn how to constantly out-do ourselves despite limited resources
The above form the three mission pillars of Pikto that we have announced to the company earlier in the year.
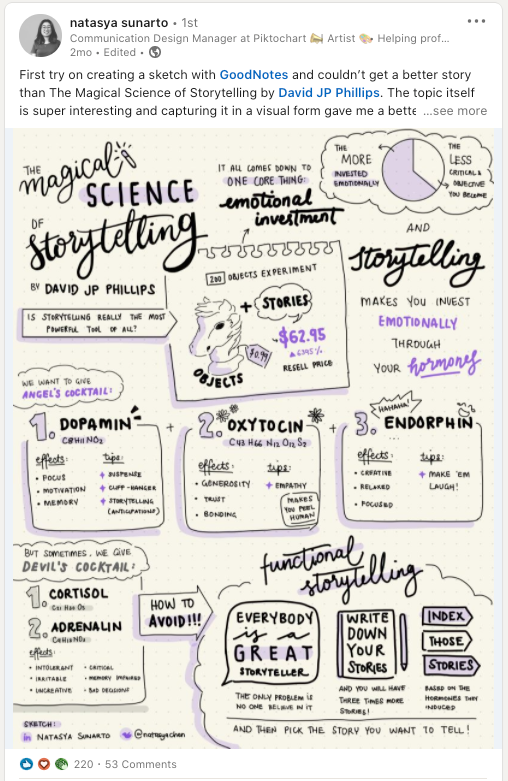
By being intentional about learning, I slot in time for my growth. I also try to encourage the rest of the company to do the same. At the same time, if we wanted to focus more on storytelling, we needed to improve our own storytelling game. That’s why our leaders started sharing more on social media in the form of text, video, and scribbles:
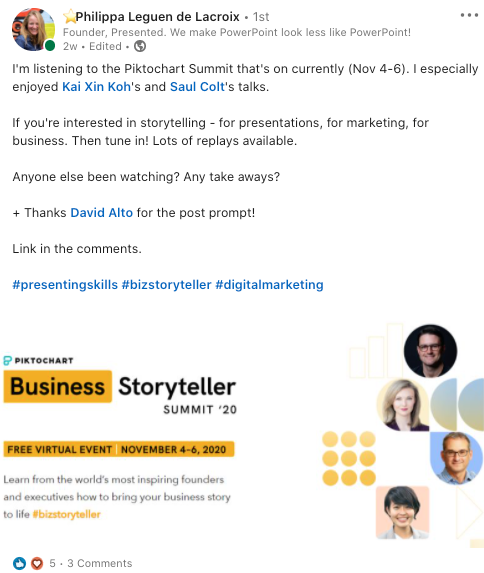
We also hosted the Business Storyteller Summit, where we have invited 17 inspiring storytelling experts to learn from.
By being intentional about people, I decided to experiment with a four day work week. I also committed to listening more, to changing our way of working, and when needed, to be ok with delaying some of the launches. Although there are times when I cannot avoid working late nights, I try to never put it as a badge of honor for others to see.
By being intentional about being bootstrapped, we learned to manage our finances more prudently as a company. We found creative ways of spreading awareness about Pikto without relying on paid channels. We also committed to not getting lured and distracted by shiny opportunities of raising funds.
Keepers of the culture
How do you keep innovating without burning out?
That was a big question to reflect on this year.
Piktochart has always been a semi-remote company, so when the opportunity came for us to evaluate whether we would ever consider being 100% remote, we jumped at it!
The future of work is going to be about flexibility, whether remote or not. It was much easier to try to build a world-class remote culture rather than trying to excel in a semi-remote setup.
The other thing was the nature of our product. Piktochart is a remote collaboration tool. Without fully understanding the nature of remote/distributed teams, it would be nearly impossible to get into the mindsets of our customers.
But becoming remote wasn’t the only change.
As the pandemic continued progressing, the boundaries between work and personal life started becoming more blurred.
Everyone was working from home now. There was nowhere to go for vacation. People stopped taking time off to disconnect.
To the parents among us with no access to childcare, working, and getting things done this year become particularly stressful.
But despite all the unused vacation and challenges with getting work done, we took a bold move to experiment with a four day work week.
This wasn’t meant to replace time off.
We still encouraged people to use up their vacation days (and quite a few people had almost the entire December off!).
We just have never believed in the equation more hours = more work done.
On the contrary, we think that well-rested team members can be more creative and can come up with more innovative solutions to problems.
Personally, I have the best ideas during weekends that I spent with my family or when I have the time to learn from others.
In Q4 2020, we announced that we are going to test out the four day work week.
These are the areas that we are going to look at to determine the success of the four day work week experiment:
- The baseline comparison on how we’re doing on all our OKRs
- The baseline of shipped vs expected
- Employee retention/attraction
- Number of sick days
We know that if we’re in it for the long haul, we need to invest in our employees’ long-lasting wellbeing and happiness.
As such, we’re very grateful that this year, three of the employees celebrated their 8th year anniversary with us, another three their six years, and five their four years. In the last 12 months, we also welcomed two Piktobabies!
Transformational
We introduced a lot of changes.
OKRs, Agile, going all-remote, and four day work week experiment. All of it during a pandemic.
The majority of people don’t deal well with change.
No wonder that we had such a bumpy beginning and a real messy middle of 2020. But you know what? The result was worth it.
Some quotes from our people:
We went through lots of ups and downs, highs, and lows. While we strive to deliver significant value to our users, we discover improvements that we can implement at Piktochart. An example was focusing on the employees’ wellbeing or improving communication between teams. A big change was the move from a physical office to a fully remote setup. Some of us may still struggle with adapting to the change. I’m one of them. No more shoulder tapping or throwing a paper ball at someone for not replying. But we will get used to it. We also have our Piktostory transformation that went from an infographic animator to a video editing tool. As part of striving to help users create much better visuals, Piktochart came up with the idea of Piktonext assisting users in delivering much better content faster.
Hong Ming, Developer
In many ways, we have improved and adapted. We become a fully remote team. We adopted tools that will help us stay connected and productive. We focused on building and updating our product to serve our users during the pandemic and global changes. We have also learned how to better market our product by zeroing in on our target personas. But we are still learning, and we will continue acting upon that new knowledge.
Ethan, Data Analyst
It’s a transformational year for Piktochart. We embarked on a new journey of building a new tool from scratch. I believe this was a bold & risky decision if not done right. We managed to change the mindset of people in the company and make them more collaborative. The team itself comes now together to ideate and find solutions instead of working separately.
Giri, Product Designer
2020 was a transformational year for Piktochart in the sense that the entire company went remote. While most of the marketing team was already remote, it still required everyone to adapt and figure out the best way to work, which led to experiments like the 4DWW. In terms of products, we launched the Piktostory beta. I think the real transformation is still ahead of us in 2021.
Robin, SEO Specialist
We started the year strong with plenty of plans to expand the Finance team. We wanted to do more to support the company’s growth. But just at the beginning of the year, 2 of our team members decided to leave. This made me rethink the way I want to shape our Finance department. I rescoped the work, eliminated redundancy and automate many tasks. The transition worked out so well! As a result, we have less miscommunication, everything is aligned, and efficiency has increased. I also learned to ask for mentorship and reached out to Finance and Accounting experts. This helped me to get out of my comfort zone. It was really a great learning journey in 2020 for me!
Maysyn, Finance Manager
1. Going fully remote
Seemed daunting at first but managed to reach a few milestones while adapting to being fully remote.
2. Launch of Piktostory
I wasn’t around from the start but it was nice to see its progress and finally be able to launch the beta version! It’s always exciting working towards innovating and coming up with new products that we hope will help people with their daily tasks!
3. First Business Storytelling Summit
I think it was a good opportunity to reach out to more people, educating and sharing the passion & importance of storytelling in business.
4. Early stages of testing out 4DWW
I felt encouraged by the willingness of the company to try out and consider different methods to see which would work best. Ultimately the company wanted what’s best for the company’s productivity and its people
Steph, Communication Designer
Talking about feedback. Below are also some excellent notes and messages from YOU, our users. They kept motivating us in 2020.
Out-do ourselves
As a bootstrapped company, we need to continually out-do ourselves.
In 2019, we were looking for “what’s next” in visual storytelling.
We identified two paths we could take. One was no-code HTML-based storytelling, and another was video.
We took the bet on videos, thinking that videos were an even more authentic way of conveying a message. You do not just get visual cues, but also verbal cues.
A whole personality comes alive through a video.
This is how the idea behind Piktostory was born.
What makes Piktostory unique is that it’s built not based on a timeline but on a transcript.
This saves a ton of time when editing.
On top of that, the pandemic brought an unexpected opportunity. Everyone suddenly was doing more video conversations than usual.
Companies started creating more video content such as webinars and summits. This created a need to quickly turn these hour-long videos into short, engaging clips for social media.
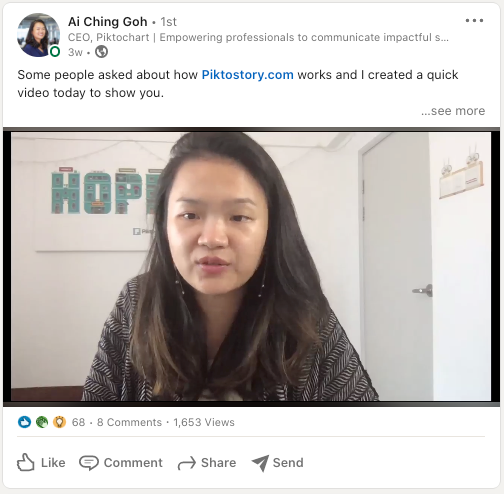
Take a look at some of the videos that were created using Piktostory. The product is out in beta now, and we cannot be more excited for the future of video storytelling!
Some of the other achievements we are proud of this year:
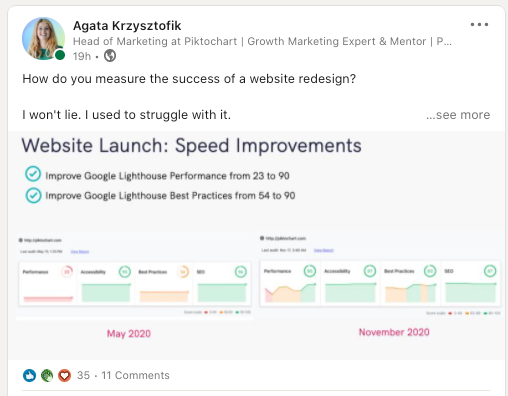
- We launched a new website in 3.5 months to improve loading speed to 100% on GTMetrix.
- Launched Piktostory beta and got 150 enthusiastic sign-ups on day one.
- Got Piktostory beta on Product Hunt and got 3rd place, app of the day.
- Piktochart is also reinventing and reimagining itself, which is a bold feat considering we’re eight years old.
- The Agile teams, which initially suffered a lot during the start, have now begun taking agile into their own hands and figuring out what works for them.
- Teams are getting better and better at shipping value.
- Teams are getting better and better at questioning the value that we’re bringing to the users and getting more in tune with our users.
Phew! That was a lot to process from 2020 at PIKTO.
What about your year?
I wish you all a fantastic 2021!

If you prefer numbers over text
Want to do a similar infographic for your company? Feel free to use this template by signing up for free.
Make an impact with professional visuals.
Make presentations, reports, infographics, social media graphics, and more.
Sign up for free