In recent quarters, our product team has been focusing on three areas.
The first is a new version of Piktochart that will make it even easier to translate your text or data-heavy content into a visual story. The second is a set of high-impact features that have been heavily requested. The third, a revamp of our pricing plans to offer more benefits across all tiers.
In May, we were able to make some progress across all these areas and we’re ready to share what we’ve released so far.
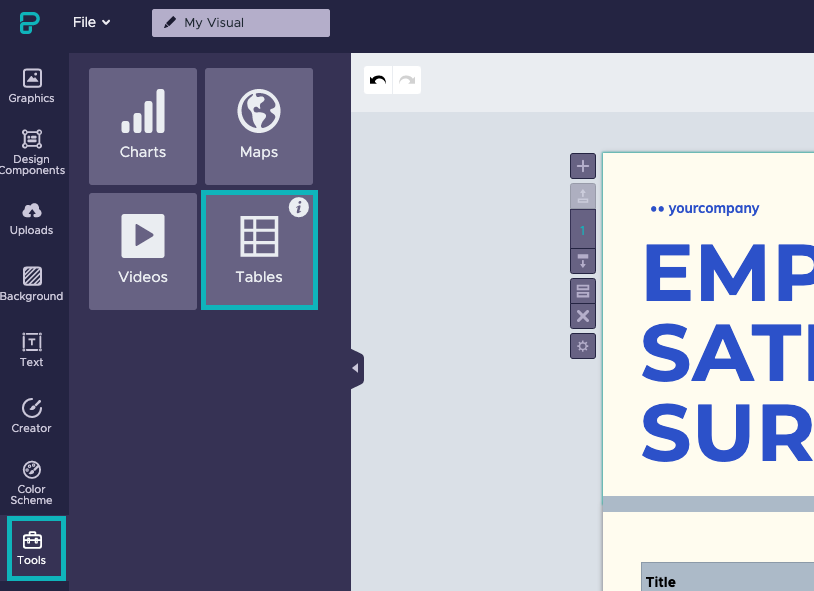
Present Text and Numerical Data With Tables (Beta)
We all love charts. But sometimes, showing the data in a tabular form makes more sense than visualizing them with graphs. For all such use cases, you will now be able to use tables. You can find them under the tools section in your Piktochart editor.
The beta version of tables includes the following functionality:
- Insert a table: insert table from Tools tab.
- Basic functions: tables can be selected, moved, copied, cut, pasted, deleted just like any other objects on the canvas.
- Resize: resize your table horizontally or rotate it.
- Edit mode: double-click to enter table editing mode. Hover over the cell you want to edit and double click again to activate value input mode.
- Add or remove columns and rows: in edit mode, right-click on rows or columns to access more options.
- Rearrange columns & rows order: in edit mode, hold down the mouse key on any row or column and drag and drop to re-arrange them
- Copy table to clipboard – click on your table and copy it to clipboard. Paste it into your Google Sheet.
Over the next months, we will continue working on adding more functionality to tables. Here are a few things on our radar:
- Importing data from Excel, Google Sheets, and a CSV file
- Copy and pasting from Google Sheets
- Exporting to PPT and CSV
- Customization of colors and fonts
Increased Storage for Graphics Uploads 🗂️
We have increased the storage for your uploaded graphics. Depending on the plan you are subscribed to, we have updated the upload capacity as follows:
- Free plan: 100 MB (previously 40 MB)
- Pro plan: 50 GB (previously 1GB)
- Team plan: 100 GB (previously 1 GB/user)
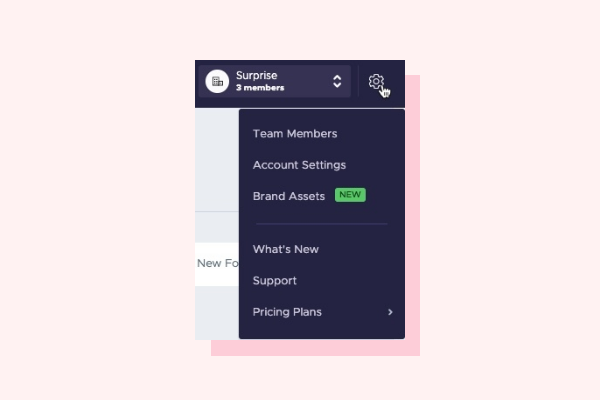
Easier Switching Between Multiple Accounts ⚙️
If you are part of multiple teams using Piktochart or need to quickly switch between your personal and work account, you can now do so through a dedicated account drop-down. You can find all the other settings such as account settings, brand assets, and pricing plans under the ⚙️ drop-down.
What’s Next: New Version of Piktochart 👀 and Collaboration in Free and Pro Plans
Our product team is currently working on the new and sleek version of Piktochart. If you would like to preview and test what’s coming, let us know.
Outside of that, we are also working on adding some new features to Free, and Pro plans: adding team members, collaboration, and more.
Stay tuned for additional updates next month!
Did you know you can collaborate on visuals with your team?
Watch this on-demand demo to learn more. The Team plan now has 100x more storage.
Watch the demo