Hi folks!
Since we stumble upon looots of infographic-related articles and news during the week, we decided to write a roundup blog post, summarizing what we have read and seen. We hope you like it – and shout out in case we missed something!
The Difference Between Infographics And Their Simpler Cousins
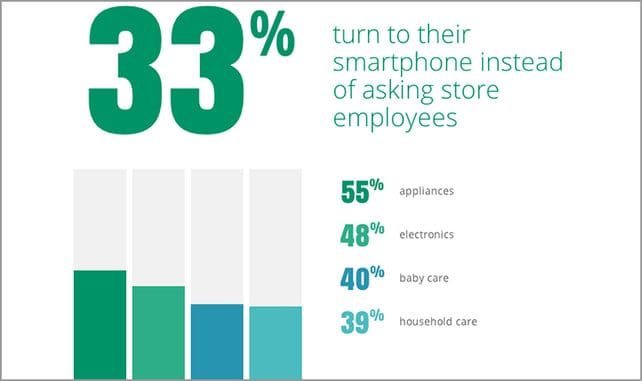
The article aims to highlight the cases when an infographic actually isn’t one, and proposes “digital poster” as a more accurate term. Although he might not clearly define what a “true” infographic is, John Pavlus poses a valid question whether everything that is a “long, scrollable JPEGs with a lot of numbers and text and clever art” can be called an infographic.

So what are digital posters good for, as design artifacts? Even Citraro finds it difficult to avoid damning with faint praise. “If neither your message nor your audience is complex, digital posters can be an excellent tool for communicating,” he says.
Read it here: http://www.fastcodesign.com/1673113/the-difference-between-infographics-and-their-simpler-cousins
If you want to jump right into creating an infographic, get started by signing up on Piktochart for free and selecting a template that sparks your creativity.
TOP 5 LESSONS ABOUT INTERNET MARKETING INFOGRAPHICS
Clarise Tan from Pinagency explores which infographics are better in engaging audience – and, more importantly, how they do it.

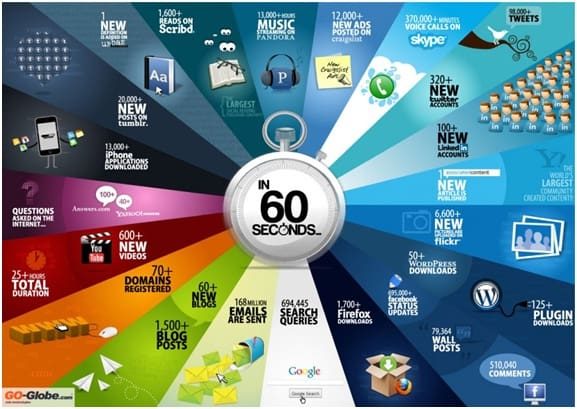
About SOCIAL MEDIA IN 60 SECONDS
“Why I Like This: What impressed me the most about this infographic ad is how it was able to provide a lot of interesting and relevant ‘sixty-second data.’ Everyone can give data about blog posts, comments, and search queries – but this one made such data unique by adding a timeframe to it.
Lesson learned: Make generic data unique by looking at it from another point of view. “
Check the remaining 4 tips behind successful infographics: http://www.pinagency.com/blog/top-5-lessons-about-internet-marketing-infographics/
Top 10 Infographics and Cheat Sheets That Make Life Easier
As always Lifehacker blog tries to make our lives easier, and there is no need to add something more.

See 10 (possibly) life saving infographics: http://lifehacker.com/top-10-infographics-and-cheat-sheets-that-make-life-eas-1154316001
11 Of The Most Influential Infographics Of The 19th Century
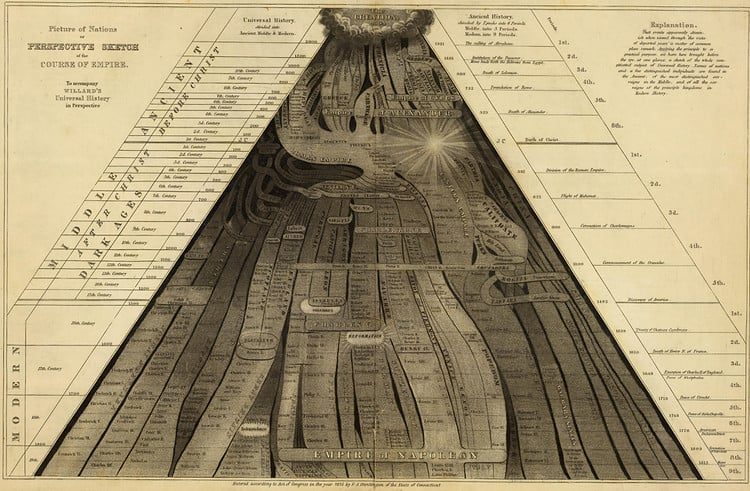
Susan Schulten, the author of, most recently, of Mapping the Nation, which surveys the explosion of graphic and cartographic knowledge in American culture, selected 11 most impressive infographics of the 19th century.

“We live in a world steeped in graphic information. From Google Maps and GIS to the proliferation of infographics and animated maps, visual data surrounds us. While we may think of infographics as a relatively recent development to make sense of the immense amount of data available on the Web, they actually are rooted in the 19th century.”
See all selected infographics: http://www.fastcodesign.com/1670625/11-of-the-most-influential-infographics-of-the-19th-century
That’s all for this week. Thanks for reading!
With Piktochart, you can collaborate with your team and create a visual together. With Pro, you can create a custom template, remove the watermark and get unlimited visual downloads. Get started for free by creating an account.
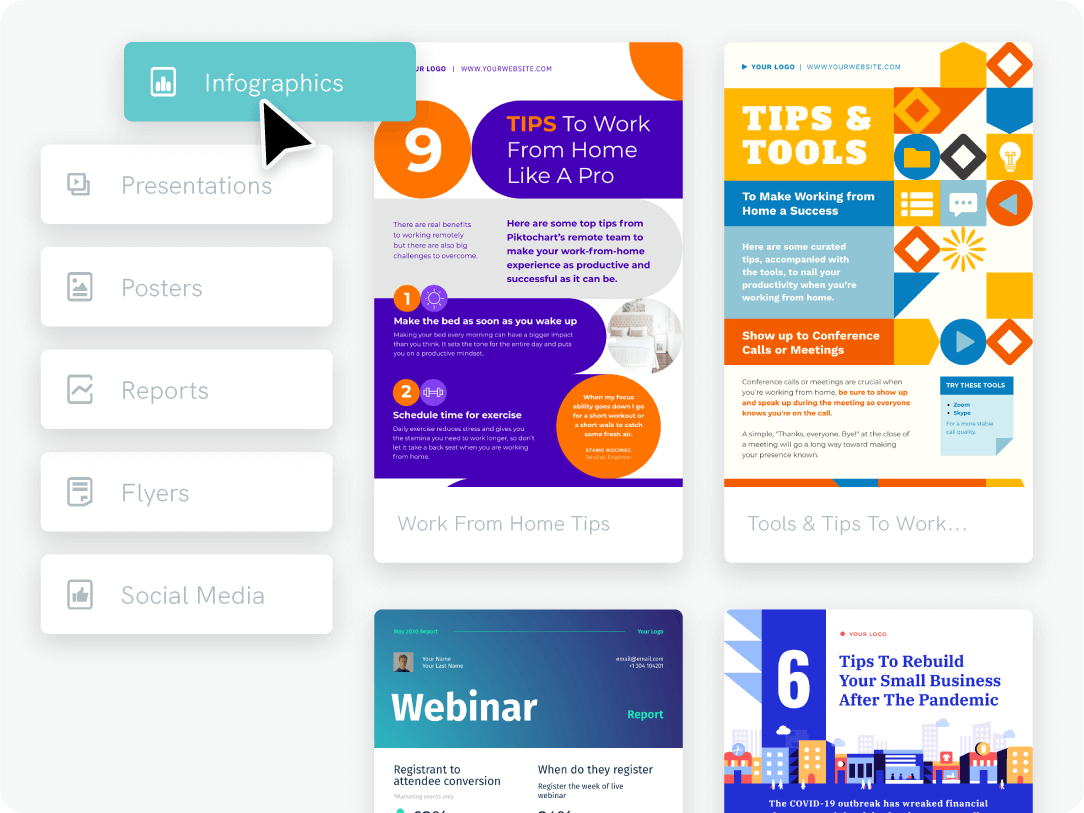
Create infographics within minutes using professional templates.
Also make presentations, reports, posters, and more.
Sign up for free


