With speedy technological evolution comes steady change for the marketing industry. Since the digital world is evolving faster than businesses can keep up with, marketers have to be on their toes and stay on top of the latest trends.
And if we zero in specifically on visual marketing, it would seem that there has been more and more statistics showing that consumers respond far better to graphics, images, and illustrations.
It’s no secret – people are visual learners and are far more likely to connect with a brand and make a purchase if the visual parts of their brains are pandered to.
Which is why we spent some time perusing a myriad of visual marketing guides to put together this very visual and data-packed resource piece that will help you, the always-growing marketer, stay on top of the latest trends.
You can either scroll down to read all, or use the below links to navigate around the post.
1. Stats For The Brain
2. Color Psychology
3. Stats For The Marketer
4. Social Statistics
5. Visual Content Statistics
You can also jump right into creating beautiful infographics with professional templates by creating a free account on Piktochart.
.
Hardwired This Way – Stats For The Brain
1. The brain likes images far more than it likes text. In fact, visuals are processed 60,000 times faster (3M).
2. People can actually retain 65% of information if it’s served up with relevant visuals. When information is presented verbally, people will only remember 10% of what they hear (Brain Rules).
3. According to an eye tracking study, 80% of people skim content when reading online. And the average person only reads 28% of text on a website (Nielsen).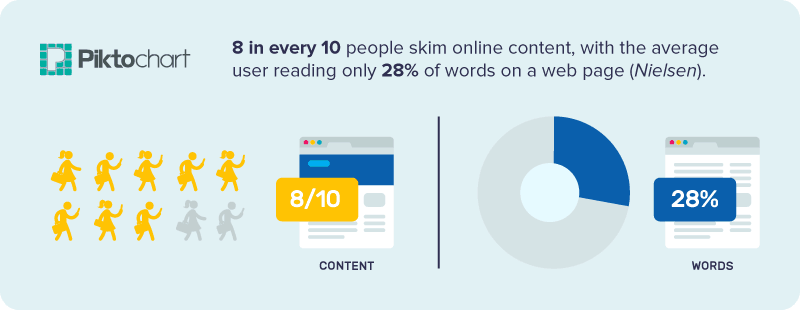
4. 93% of all human communication is almost non-verbal, which means that our brains prefer to perceive visual cues (DMP).
5. 65% of the human population are visual learners (Social Science Research Network).
6. Research shows that people following illustrated instructions do 323% better than those who were just reading text (Indiana University).
7. According to eye-tracking research, people will actually spend 10% more time looking at visuals on a website than reading text (Nielsen).
.
Video Statistics
8. Video rules the roost in marketing! 60% of marketers already use video, with 73% planning on creating more video content in the future (Social Media Examiner).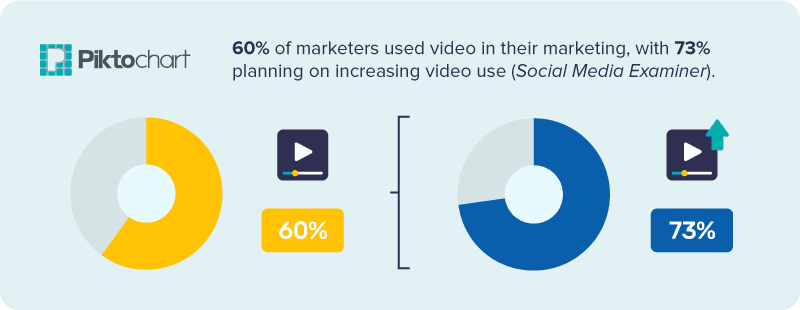
9. Facebook live videos are watched 3X as much in comparison with videos that are no longer live. Turns out, living in the moment is far more interesting (Facebook).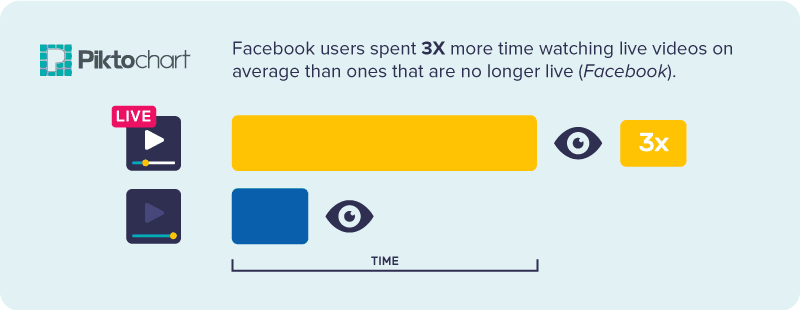
10. Last year, 50% of all video plays were actually done on a smartphone. And more are flocking to mobile for their videos, as this number was up 203% from 2014 (Ooyala).
11. Most people love short-form video. The videos that run anywhere between 0-5 minutes make up for 55% of mobile video plays (Ooyala).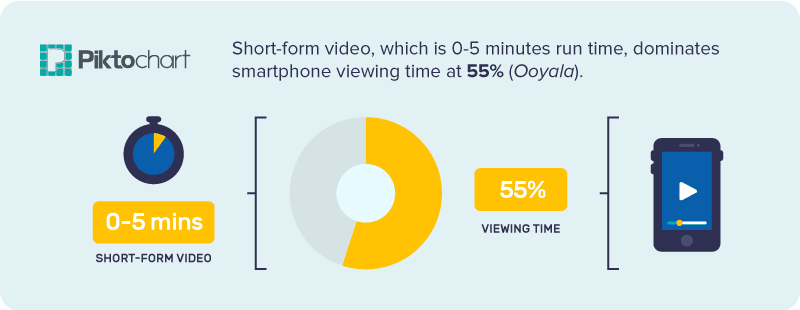
12. Don’t spend time on fancy voice overs! 85% of videos on Facebook are watched with the sound turned off (Digiday).
13. This year, video content is king. It will make up for 74% of total web traffic (KPCB).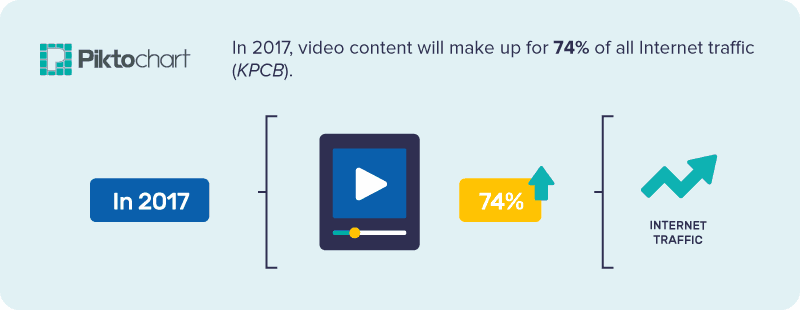
14. Having a video on your landing page pays off. In one study, it boosted conversion rates by 86% (CrowdRiff).
15. 4x as many consumers say they prefer to watch a video instead of reading a product description (Animoto)
16. 25% of consumers say that they don’t find a company nearly as appealing as others if they don’t have a video (Animoto).
17. Articles that contain video content reportedly get 300% more inbound links than video-less posts (KissMetrics).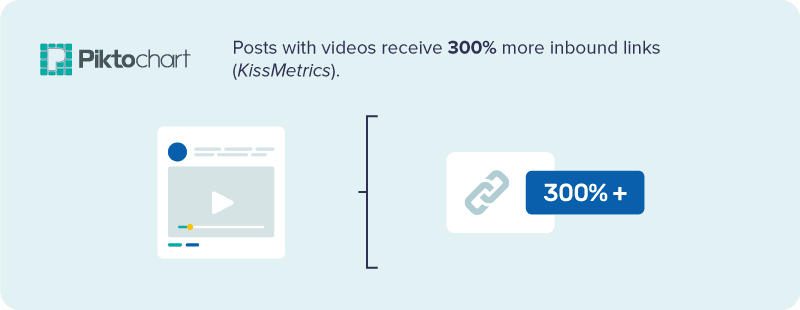
18. There’s no stopping video! By 2019, video content is forecast to account for 80% of global web traffic (Cisco)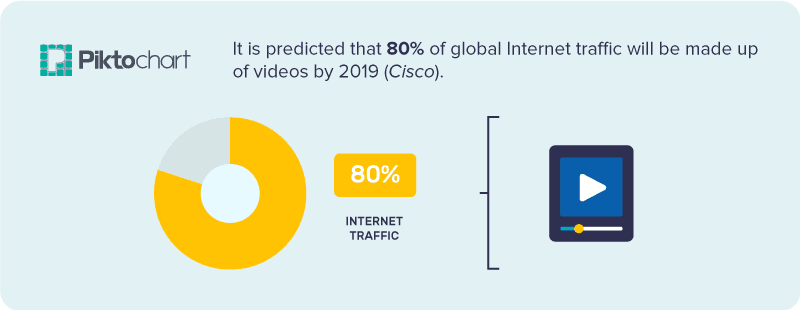
19. Boost your email marketing with video and get a possible 300% increase in click-through rates (Cisco).
20. Video leaves a lasting impression. 80% of people say that they remember watching a specific video ad in the last month (Cisco).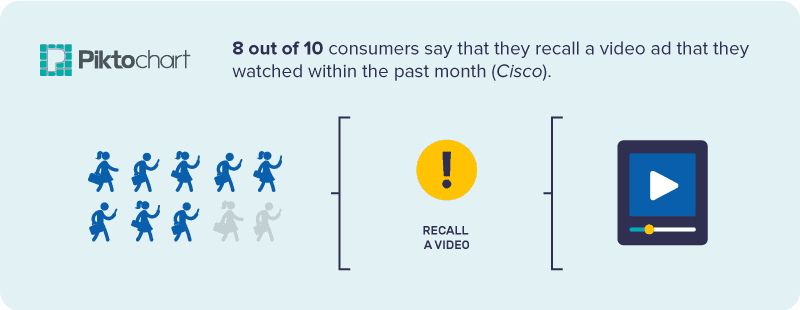
21. Product demo videos work, prompting 74% of consumers to buy a product after watching (Cisco).
22. 360-degree videos are growing in dominance, scooping up 29% more views than the same video that isn’t in 360 (Manifyre).
.
Color Psychology
23. By using color, brands can actually boost their brand recognition by 80% (Xerox).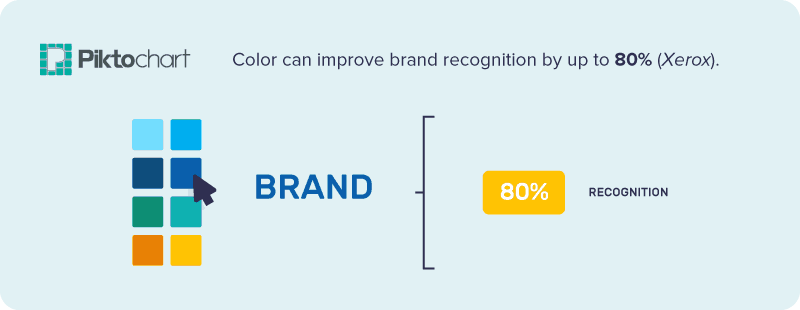
24. Color boosts attention span and recall by up to 82%. With color, a person is 80% more likely to read a piece of content (Xerox).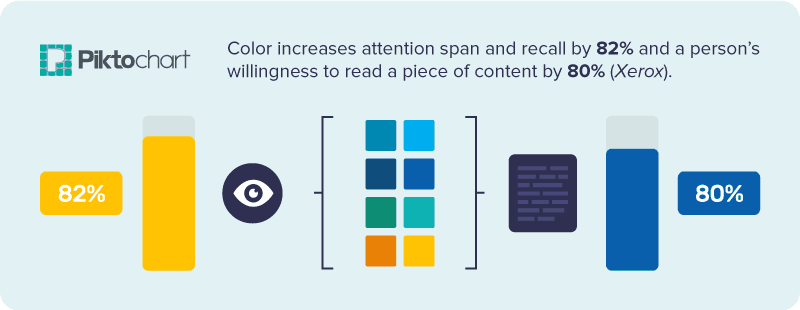
25. Don’t waste time with black and white! Information can be found 70% faster if it’s in color (Xerox).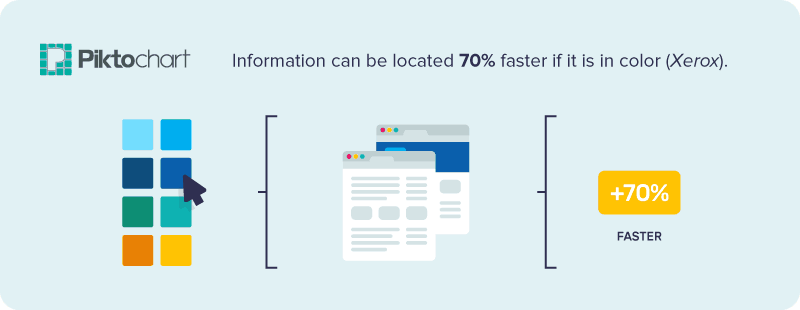
26. 90% of snap judgments that consumers make about products have to do with color (Journal of Management History).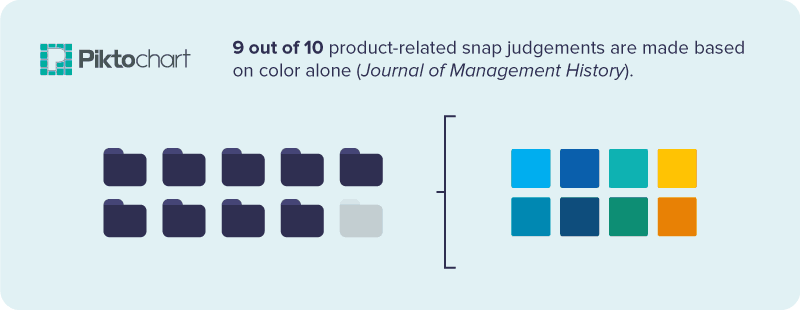
If you are convinced about the importance of visual communication, feel free to create an account on Piktochart and get started on your visual storytelling journey!
.
Stats For The Marketer
27. Last year, over half of surveyed marketers said that 91% to 100% of the content that they created contained visuals, up 130% from the previous year (Venngage).
28. In terms of time spent making visuals, 71% of marketers say that they spend less than five weekly hours creating visuals. 56% say that they use less than 20% of their marketing spend on visuals (Venngage).
29. Research shows that people are 50% more inclined to read email newsletters if it includes video content. Or at the very least, a link to one (Animoto).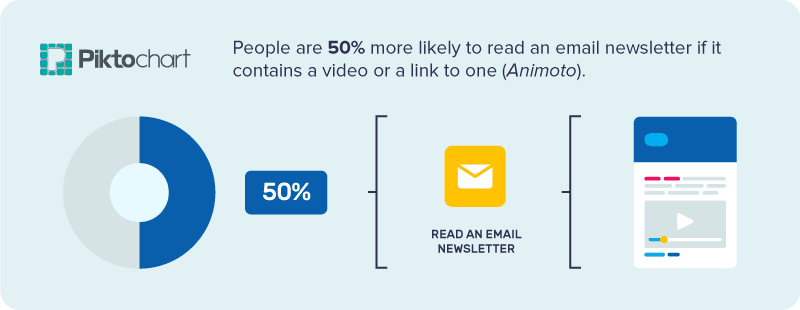
30. When it comes to communicating brand story, 65% of senior marketers believe that visuals are core to their strategy (CMO Council).
31. Photography is core to the visual marketing campaigns of 46% of senior marketers. 36% say that video is most important, 19% prioritize infographics, and 15% illustrations (CMO Council).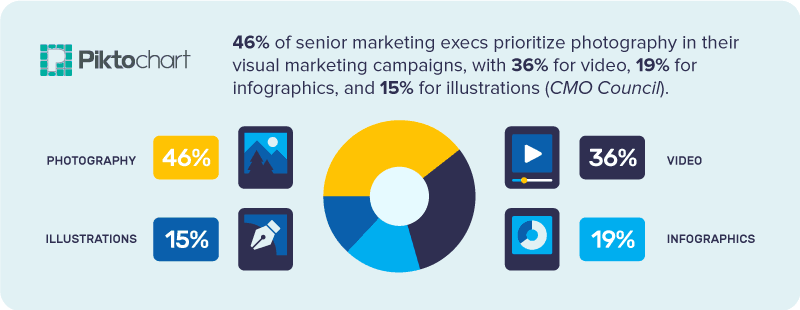
32. Last year, 74% of surveyed marketers said that they used visual assets. This was a leap up from the previous year, up from 71% (Social Media Examiner).
33. 50% of marketers say that they plan on using live video tools such as Periscope and Facebook Live (Social Media Examiner).
Social Statistics
34. 75% of Instagram users will “take action” after viewing an advertisement on the platform. 43% of those consumers will feel the urge to make a purchase (CrowdRiff).
35. 88% of Pinterest users will buy something that they have pinned (CrowdRiff).
36. What do 93% of highly engaging Facebook posts have in common? They are all photo posts (Social Media Examiner).
37. Facebook is predicted to be made up of all video content by 2021. This is due to the inevitable abandoning of text (CBC).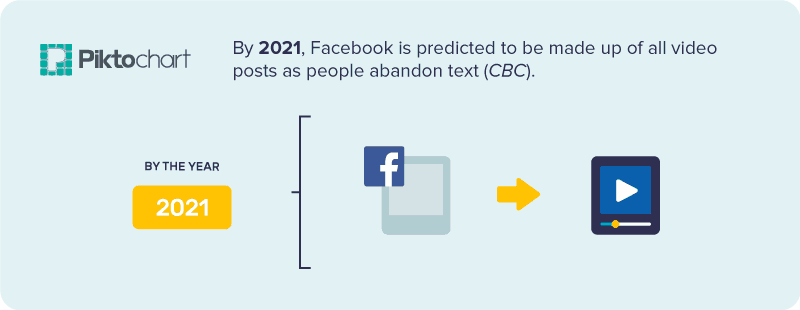
38. Tweets that contain images get retweeted 150% more times than the posts that don’t (KissMetrics).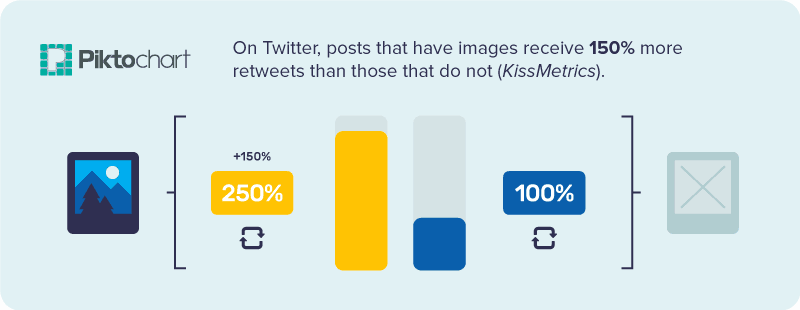
39. Instagram posts that contain human faces are preferred. They’re 38% more likely to get liked, and 32% more likely to get commented on (Georgia Tech-Yahoo Labs).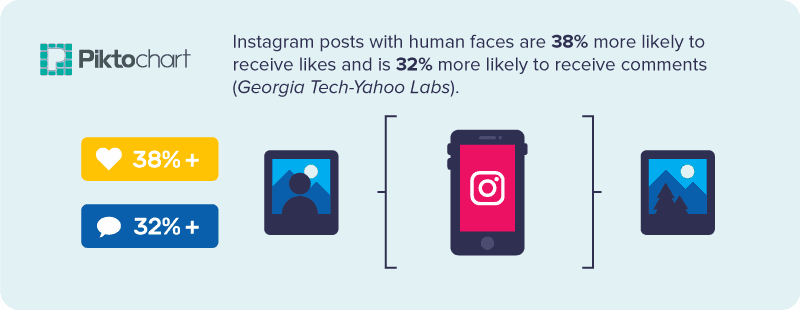
40. Slideshare clocked 70 million users as of the beginning of January. It’s particularly popular with B2B marketers in North America, as 41% of them use Slideshare to distribute content (LinkedIn).
41. 63% of all social media feeds are made up of visual content. And 32% of that content comes from video (Citrix).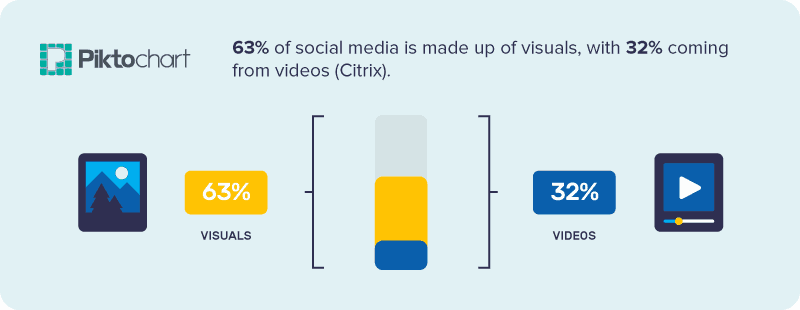
42. Contrary to popular belief, Pinterest images that don’t contain human faces are more popular. They get 23% more repins than the ones that do (Sprout Social).
.
Visual Content Statistics
43. Articles decked out with visuals perform better on social media. Posts that contain an image once every 75-100 words will get shared 2X more on social (BuzzSumo).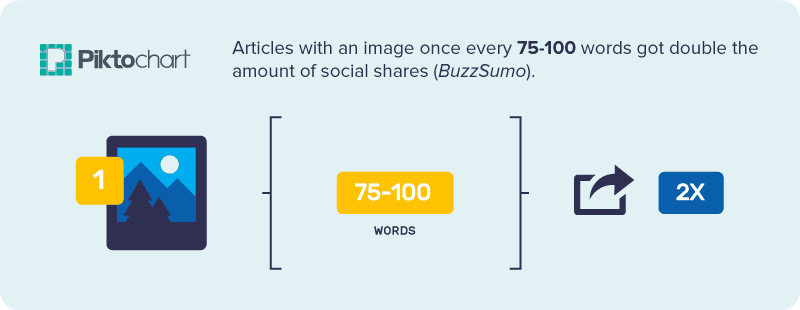
44. One study shows that traffic for your blog posts can increase by 48% if you include visual content, such as images and video (DMP).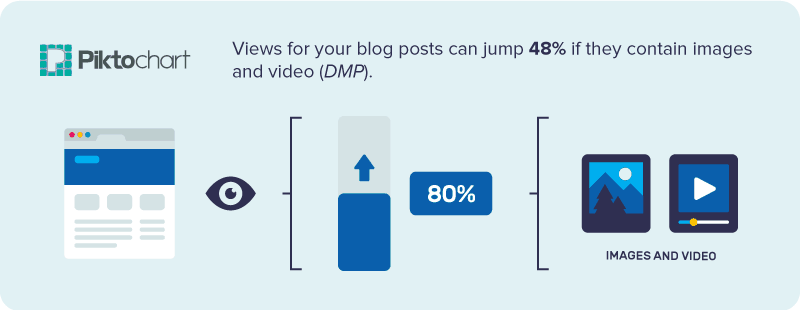
45. Armed with visual content, studies show that you can grow your social media following and subscribers by 37% (DMP).
46. Research shows that articles containing visuals can get 94% more views (Jeff Bullas).
47. Research shows that people are 40X more likely to share visual content on social media (Buffer).
48. Restaurant menu items that are shown in images are ordered 30% more times than items without images (CrowdRiff).
49. Stock photos are the go-to visual for marketers, being used 35% of the time, with infographics following at 30%. Videos and presentations are used by 15% (Search Engine Journal).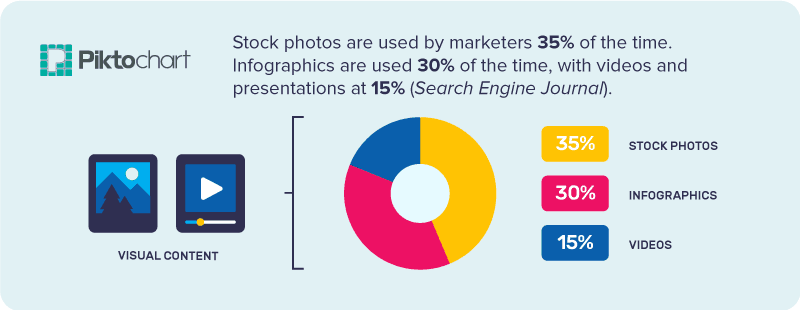
50. Infographic uptake by B2B marketers grew from 50% to 58% between 2015 and 2016 (Content Marketing Institute).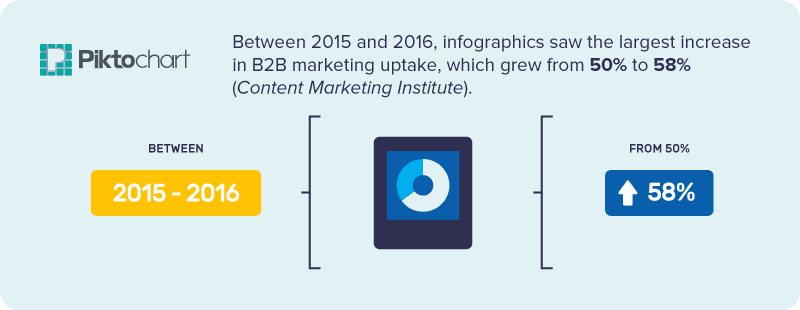
Throughout your career as a marketer, you’re likely to be creating more marketing reports than you can count. Perhaps you find yourself spending more time crunching data and plugging numbers into graphs than actually working.
Marketing reports don’t have to be as time consuming as they often are, which is why we tapped into the brilliance of Kevan Lee of Buffer in this interactive content experience to help you with them. Dive right in here, and learn some marketing reporting hacks from Kevan.
Now that you understand exactly how indispensable visual marketing is, you can start making some visuals of your own. Sign up for free and create beautiful presentations, reports, posters, infographics, and more with Piktochart.
Our designer Maxi Albella recently wrote a blog post on some of our most versatile infographics templates, which are perfect for marketers with non-design backgrounds.
Here are a few to spark inspiration:
1. Business Basic – a very versatile template that works for every business scenario.
2. Startup Basic – a flexible template that channels the agile startup spirit.
3. Minimalist 2 – a template for those that believe less is more.