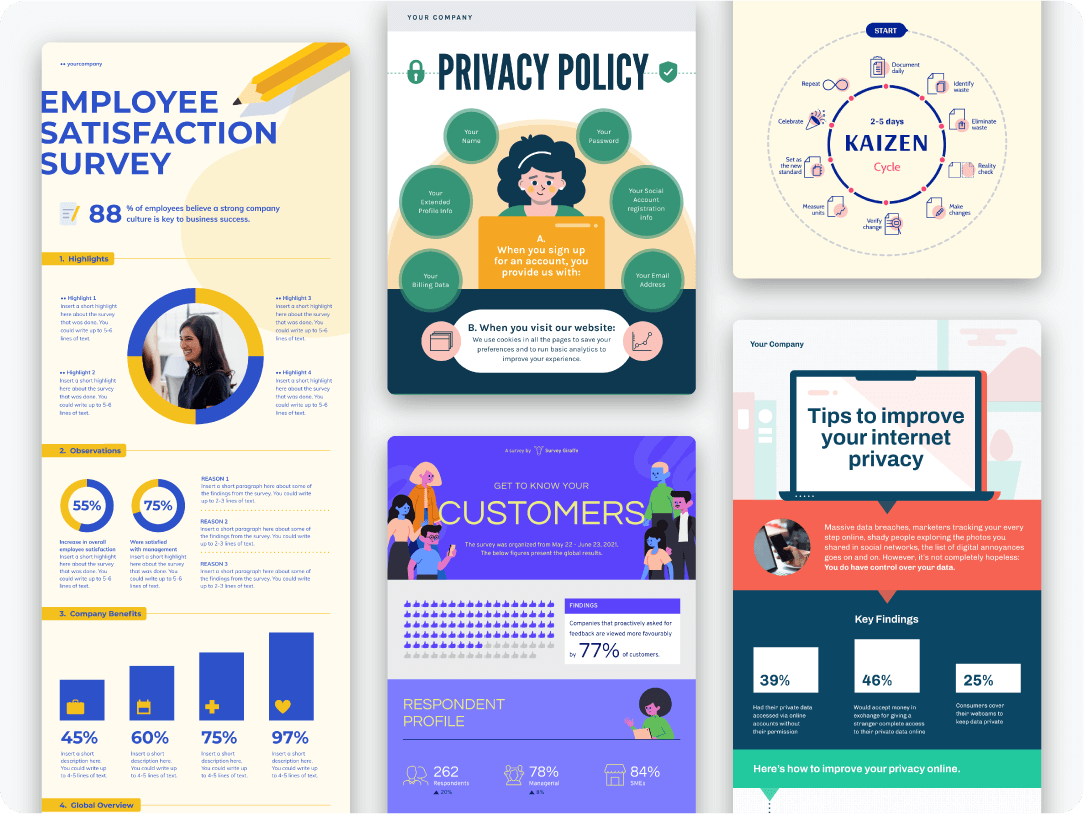
We know that the web is now filled with infographics. Is it still possible to come up with infographics that stand out and get attention from the mass?
The answer is yes and yes. Think about it. What makes you click on the “Share this” button on the page where you saw an infographic? Here are 3 tips to structure your story so that you can get started:
You could follow along by creating a free account on Piktochart.
1. Make it relevant.
As every infographic is essentially a pitch, ensure that you know who you are talking to. If your target audience does not understand jargons, keep them out of your infographic. Get into their minds – what pains them most, what gets them the light bulb as they are reading it? How do you keep the topic easy to understand?
2. A common subject made unique.
This has to do with a lot of clever writing but like all email headers, you know that how much people read depends on the subject line. If you had stats that showed a 10% reduction in crime rate and that really is something to be celebrated about, turn it into something more meaningful – what interests people about crime rate reduction?
Instead of “10% reduction in crime rates in NY”, you want to end up with a story that sounds like “3 possible reasons why crime rates went down in NY”.
3. Create a data-driven story.
Once you have figured out:
- Who your audience is and what topic they would be interested about
- How cleverly you can make the subject more interesting
Then all you need to do is to roll it out in a structured format:
- A grand big title
- An introduction of why the topic matters (Why a 10% drop in crime rate is a big figure)
- Point 1 – Reason 1 why crime rate went down
- Point 2 – Reason 2 why crime rate went down
- Point 3 – Reason 3 why crime rate went down
Once you have the above ready, you are on your way to create a flabbergasting infographic, which does not take rocket science.
Get your creative juices flowing by accessing our templates for infographics, presentations, posters, social media graphics, and more. Sign up for free to get started.
Up next, a designer’s tip on how to best leverage Piktochart to easily get the best designs! 🙂
A design tool for everyone.
Make infographics, presentations, reports, posters, social media graphics, and more.
Sign up for free


