We know that infographics are more than just marketing and brand awareness assets. At Piktochart, we talk a lot about using infographics in areas like the classroom, and there are a range of other domains where they can be used to inform and educate. One area that surprisingly doesn’t get a lot of attention is internal communications, and how infographics can be used to educate, inform, and inspire internal teams and stakeholders.
All organizations need effective communications to keep the wheels turning and to get the results they want. And just like anywhere else, visual content is a crucial part of the mix. Infographics boost engagement, open the doors to visual learning, and help create a vibrant culture of idea sharing.
Our internal teams rely on infographics for pretty much everything we do. From presenting and reporting, to training and promoting, we’ve got an infographic for every business scenario. It’s our go-to communication tool.
Kickstarting your internal comms with powerful visual content is easy. Here are some of our favorite ways to do it!
Presentations
Awesome visuals enhance and bring presentations to life. It’s true. Look at any TED Talk (Here’s one by our former UX researcher Eureka).
Piktochart uses visual content for all the internal presentations that we make. Our Monday Afternoon Meeting is a prime example. Staff members of all backgrounds take the stage and use infographics to share updates, announcements, and research.
Infographics make presentations better because our brains click with visual information. Infographics break ideas down into their bare bone essential data points and messages. Diverse audiences with no topic experience can quickly absorb information and walk away with something.
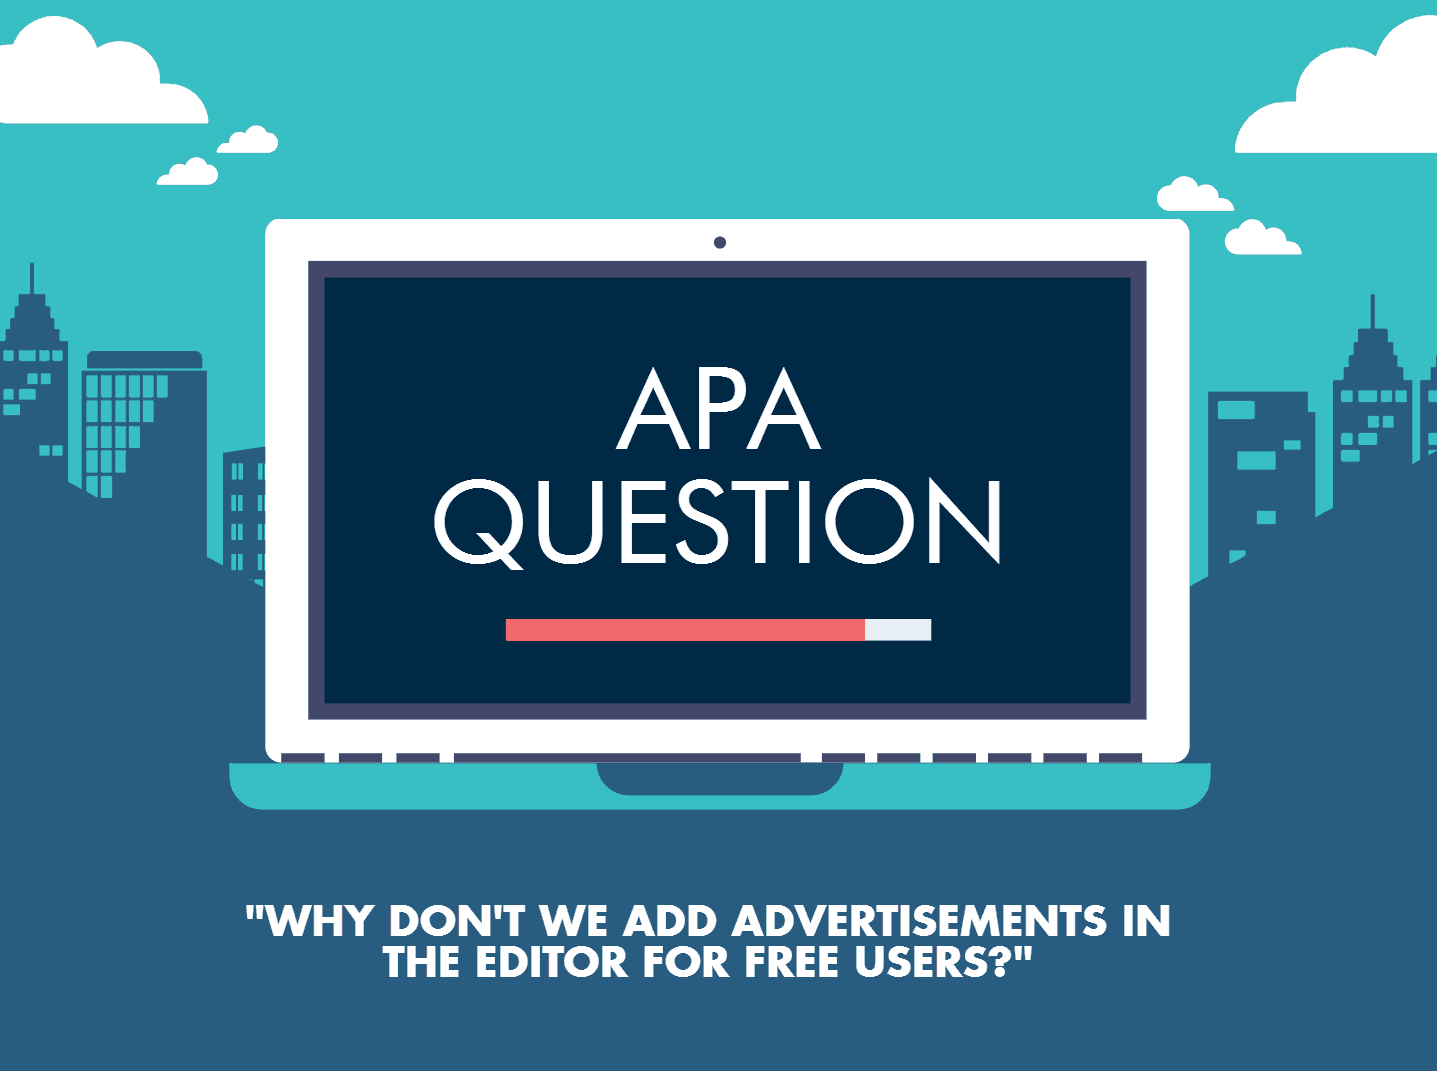
Click the below image to see our presentation on the use of advertisements in the Piktochart editor.
Reports, Updates, and Research
Reports aren’t ideal for conveying information quickly or to multiple internal audiences. People don’t always have the time to read, but they still need to know what’s going on. Infographics deliver concise targeted information that enables broad understanding and high levels of comprehension. When audiences need to know more, they can pick up the report.
Long form content of all stripes, from financial reports to white papers, can all be condensed and presented in infographic form.
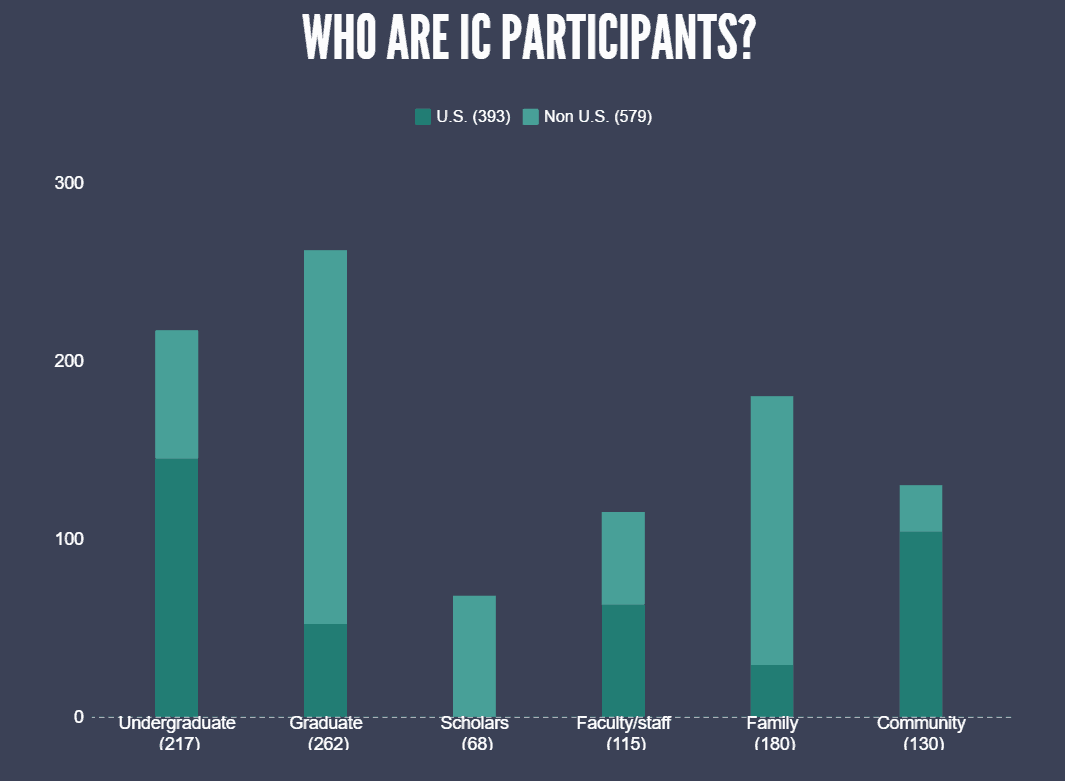
Click the below image to see an annual report created by the University of Virginia’s Lorna Sundberg International Center, an example of taking a stale content format and giving it some visual love.

Processes and Workflows
Communicating a workflow is a visual operation. That’s why they invented flowcharts. When trying to describe how your marketing funnel or distribution system functions, words often just don’t cut it.
Infographics can help illustrate the way these processes and sequences work. This can cover everything from marketing and sales funnels to editorial processes and shipping and logistics pathways. Think of infographics as enhanced flowcharts, with added presentation capabilities and boosted capacity to provide more information.
The below image is a visual we created for Piktochart’s marketing funnel.
Planning, Strategy, and Decision Making

Infographics are also a prime tool for visualizing planning and strategy efforts, brainstorming sessions, and decision making approaches.
If you’re white-boarding a strategy session with stakeholders, an infographic is a fantastic way to organize the output for everyone to read and take away. Likewise, if you’re trying to communicate a strategy, or a marketing plan, infographic thinking can help visualize the details, clarify the goals, and help garner support by visualizing each user’s part in the program.
Decision making can also benefit from the infographic touch. Infographics can help visualize and identify outcomes, connect the stakeholder and resource dots, provide background data, and show comparisons between options and variables – all within a simple graphic.
Click the below image to see how the North Mississippi State Hospital communicated an upcoming PR campaign.
Job Scopes, Postings, and Recruiting

Over in HR, infographics are a clever way to arrange and communicate a range of data pertaining to hiring programs, job postings, recruiting, or internal benefits and wellness programs.
At Piktochart, we regularly rely on infographics to outline job scopes, explain hiring needs, and to communicate with recruitment teams and upper management.
Programs, like benefits or compensation, can be famously complex and getting buy-in from internal personnel can be difficult. Here, infographics come brilliantly to life, offering simple ways to break down dense material and capture the essential points employees need to get on board.
Training and Education

We spend a lot of time celebrating infographics in the classroom. Here are some of our favorite posts. For learning in the workplace, infographics are a natural fit for distilling training information and driving professional development efforts home.
Piktochart’s Wednesday lunchtime sessions are a great example of making infographics work for learning. At these sessions, team members take turns presenting a topic of choice and use a fun infographic to present the information.
Click the image below to see one of Piktochart’s
Wednesday lunchtime presentations on Spain.

In more technical scenarios, infographics can help summarize complex information, and even be printed and inserted in training manuals to distinguish the salient points trainees need on the job.
For workshops and sessions, infographics can be printed out into handout collateral that can be taken home or back to the desk. Larger poster-sized infographics can be a key communications piece around the workplace to broadcast all kinds of important information.
Rules, Guidelines, Instructions, and How To’s,
In addition to training, there are many instances where instructions or policies can be communicated via infographic. How do I fix the copy machine? What do I do with the recycling? How do I invoice and how do I get paid? There’s an infographic for all of that.
Visual instruction manuals for machinery, furniture assembly, and airplane evacuation are classic inspiration for how you can use visual content to inform your teams and influence behavior change on items like email and social protocol, equipment operation, or best practices.
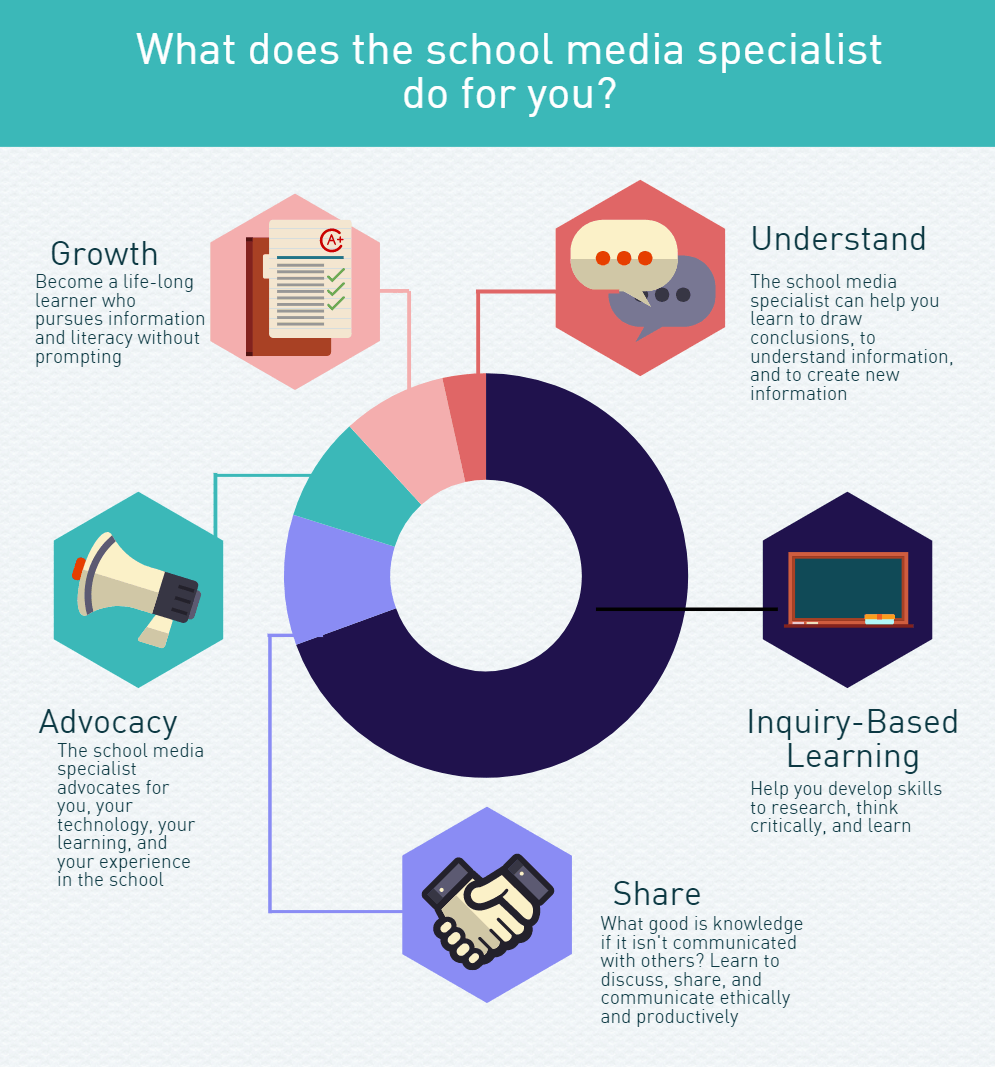
Below is an example presentation explaining the value students can get from their school library media specialist.
Promotions and Celebrating Success
There are times when you need to promote and market. That’s a big part of internal communications. Visually charging those communications is an impactful way to boost engagement and turn heads.
An infographic can help capture the accomplishments of a department, with enough detail to tell the story of who, what, and how. Teams can also use infographics to communicate to the rest of the organization what they’re doing, who they are, and the great things they’ve been achieving. For example, a new department might use an infographic to broadcast their existence to the rest of the company and let everyone know how they can help other teams.
There’s a lot of other things going on that often need shouting out — and infographics are first-rate content for internal blogs, intranets, newsletters and social media. There’s also great opportunity to promote internal programs like workplace safety or productivity.
Below was a set of posters that we created for #RAK (Random Acts of Kindness) week.

Make Your Content and Your Teams Shine
Communicating effectively is critical to the life of an organization. But it’s a challenge to get people’s attention and change behavior, especially when we’re constantly inundated with information and messaging from all sides. Rich and informative visual content can help your internal communications rise above the surface.
Infographics can help deliver messaging in ways that really resonate with audiences. By activating those visual learning parts of our brain, visual content can help us retain and understand information, and keep us interested in what’s going on.
Here at Piktochart, we are passionate about infographics and are constantly working to improve the way our teams communicate and share knowledge. While it’s key to have easy-to-use tools at your fingertips, it’s also important to give your teams the encouragement to get creative, approach things differently, and have fun.
To end things off on a fun note, check out the below poster our marketing manager Marta made for Movember (unintentional alliteration!).