All the buzz about education technology begins to gain a solid ground. According to the Joan Ganz Cooney Center, which compares five surveys of teachers and their practices and uses of technology, teachers are increasingly using more and more applications to enrich students’ learning experience. “Digital tools are being used by students to conduct research, download and submit assignments, edit work, and collaborate with each other.” (Pew, p.37). Tools include class blogging or wiki platforms, Twitter, Pinterest, Evernote and other applications – infographic apps.
We asked few teachers to share their opinions and experiences on infographics in classroom, as well as examples of their projects.
Introductions
 Jon Tait is Assistant Head Teacher responsible for leading the development of teaching and learning across the whole school (Woodham Academy, UK). Jon’s Twitter and blog.
Urvi Shah is the Director of Educational Technology and Innovation – she models seamless use of technology within curriculum, develops and implements teacher PD based on best practice in education and emerging technologies (Stone Ridge School of the Sacred Heart, US). Urvi’s blog.
Vance Kite is High School science teacher and Leader of freshman academy. (City of Medicine Academy, US). Vance’s blog and YouTube channel.
Mia MacMeekin is Lawyer, educator, instructional designer (Stratford University; Epigogy, Inc; Liberty University; US). Mia’s Twitter, blog and Pinterest.
Shayne Swift is the International Baccalaureate Program Coordinator (Parkdale HS; PGCPS, US). Shayne’s Twitter.
What do you look forward to most in your job?
Jon: Making kids smile and providing teachers with new strategies to engage students and improve their own teaching practice.
Urvi: Working collaboratively with teachers and students.
Vance: Seeing students engaged on a daily basis. Creating lessons that don’t suck. Helping teachers to be better at what they do.
Mia: Connecting with students, making concepts easy to understand.
Shayne: Providing multiple pathways for students to access and demonstrate what they know.
What are the essential things you cannot live without at your workplace?
Jon: Wifi! Supportive staff, humour, lunch!
Urvi: Technology and the resources to innovate immediately without great limits.
Vance: Laptop, internet connection, projector, lab benches.
Mia: Markers, paper, students, other faculty to talk to. My iPad.
Shayne: Innovation, creativity, choice.
Infographics
How did you use infographics? For what lessons/ projects?
Jon: I have mainly used infographics to support teacher training.
Urvi:The infographics were for a project in World Issues class about Genocide. In previous years, students have written essays on the topic; however, this year we decided to try something new. The result was amazing. We underestimate how challenging it is for students to take large amounts of information and transform it into a visual diagram. This was the greatest learning outcome of this project: filtering data, distilling data and choosing visual tools to represent the bite-sized pieces of information. To create the infographics, we used an online tool called Piktochart and asked students to use their design knowledge to modify the templates. The “behind the scenes” work included research, note taking and creating a bibliography. The final product was an informative visual display which we later printed to display in the hallways.
Vance: I’ve had students create infographics on topics such as controversies in public health, the American obesity epidemic, STDs, and the environmental impact of their purchases.
Mia: Students used infographics on a crowdsourcing project in Ethics and any other presentation, I use them to explain work flow and assignments.
Shayne: We are taking a thematic approach and looking at hunger, homelessness and poverty in 8 subgroups. Students will report the using an infographic. We are looking at the role of color, images, space etc in designing effective infographics. We have also begun sharing our infographics locally and globally and as a result we are partnering with a school in Mexico to extended our conversations. We have printed out the infographics to share with our school community. The infographics were a springboard to our YSA semester of service and we will continue to learn more about this issue.
Would you recommend other teachers/educators to use infographics in their classes? Why?
Jon: I love them and think that they are the best way to present a lot of complex information in an easy to read format. They would be great for producing summaries of topics. Simple ‘Go To’ guides that can be saved as jpegs and stored in students’ phones on their photo library. This way, students can have all their study guides with them wherever they are, meaning they can study ‘on the go’.
Urvi: Yes but it’s easy to use and students learn the crucial skill of distilling large amount of data and find ways to display it visually.
Vance: Absolutely! Infographic present data in a way that is much more compelling than traditional formats. Asking students to create infographics forces them to consider the presentation and layout of their material, as well as, the actual content of the material itself.
Mia: Yes, everything in picture form speaks volumes
Shayne: Students are excited about presenting big data in a meaningful way through the use of images. I see this as a tool for PBL/CBL. I also think that piktochart in particular was easy to use and the templates were helpful. I gave students 5 choices to use and they all chose Piktochart.
Where do you obtain the data for your infographics?
Jon: Either personal experience or crowdsourced information from my network of teachers on Twitter.
Urvi: Students obtained their data from sources all over the internet. They were required to present their research and data to the teacher prior to creating their infographic.
Vance: Students obtain the data needed for their graphics while conducting research for their projects. The most important thing is to structure the project requirements such that students are required to use data and statistics to back up statements that they make in their projects.
Mia: People, books, Internet, self research.
Shayne: Reputable sites like UN, the World Bank, .govs and WHO. See our Hot list here (Google Document).
Examples
Here are some examples. We have already featured some Mia’s infographics in a previous blog post (“Back to school: 14 useful infographics for teachers”), check it out!
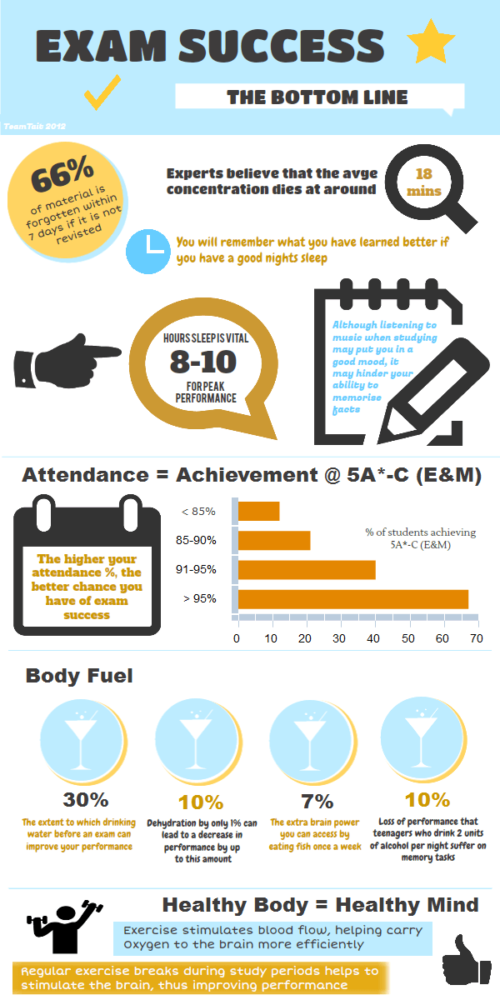
Jon‘s infographic:
Urvi‘s shared infographic:

Vance‘s shared infographic:

Shayne‘s shared infographic:

Extra for inspiration
Josh Millsapps (his Twitter) merged video and Piktochart infographics – see the result:

More Piktochart examples