In this article, we share a few case studies on how companies growth hack their traffic using infographics. It’s a powerful tool that you can learn to apply similar tactics for your organization. These are examples of growth hacking with infographics done right.
Stats don’t lie
For starters, check out an infographic published by B2B Marketing Infographics that illustrates some interesting statistics from MDG Advertising blog in using visual content in social media marketing.

The statistics provided are compelling enough to dictate that any social strategy your company is currently running must involve visuals. Otherwise, you are likely to be losing out in the attracting the readers’ attention war.
- Publishers who use infographics as their marketing weapon can increase their traffic by 12%. Photos are liked twice as much as text updates on Facebook.
- 94% more total views on average are attracted by content containing compelling images than content without images.
- 67% of consumers consider clear, detailed images to be very important and carry even more weight than the product information, full description, and customer ratings.
- 60% of consumers are more likely to consider or contact a business whose images appear in local search results.
- 37% increase in engagement is experienced when Facebook posts include photographs.
- 14% increase in pageviews are seen when press releases contain a photograph (they climb to 48% when both photographs and videos are included).
Seeing such promising results, dubbed the “the rise of the visual web”, more and more companies are jumping on the infographics bandwagon to increase traffic of their websites and social media pages.
Mint is one of the most popular example that have successfully utilized the power of infographics. In their blog, Mint published many funny yet educational infographics that touch on general topics of life. This has led to many blog owners and other reputable websites embedding Mint’s infographics into their website and subsequently boost the ranking of Mint.
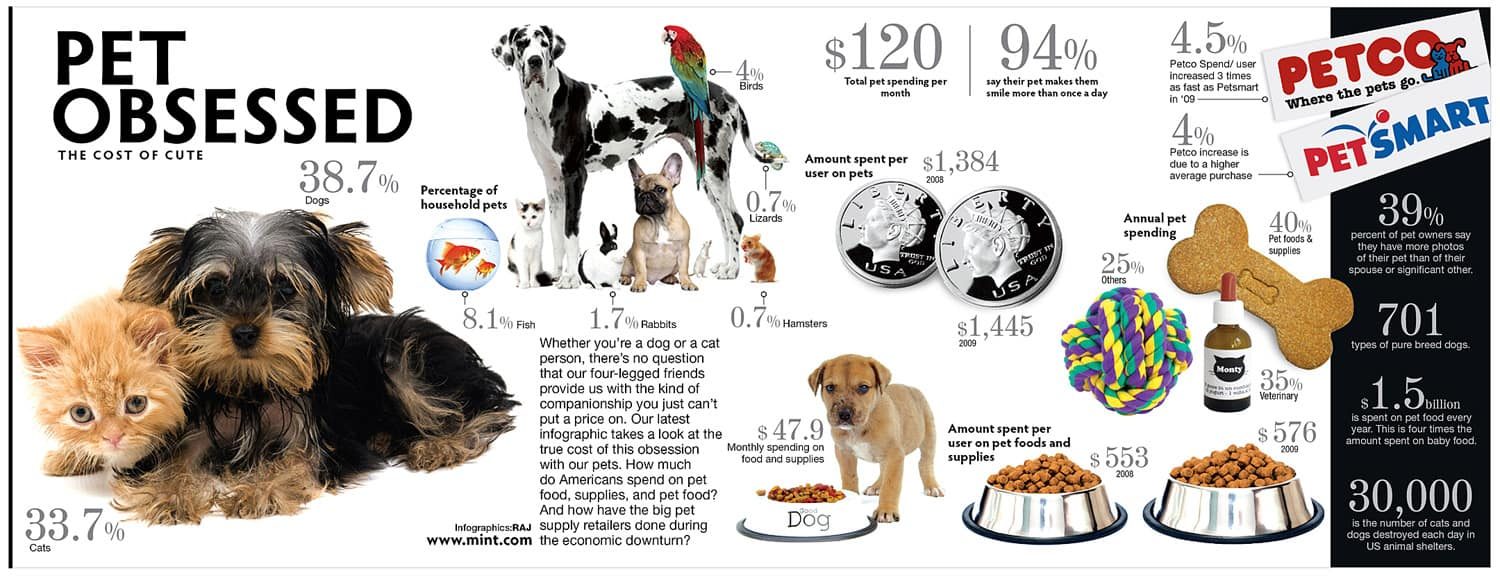
Pet obsessed: The cost of cuteness
This infographic is based on the aggregate data from over one million Mint.com users, a representative sampling of US consumers, along with data from wiki.answers.com.
(source: Mint.com)
Customer Magnetism, an internet marketing agency also have huge success by publishing infographics on their website. According to them, one of their particularly popular infographic titled “What is an infographic”, has generated hundreds of favorable social media tractions:
- over two thousand unsolicited inbound links (including sites like adobe.com)
- generated over 20,000 unique visitors to their website page hosting that infographic alone

Click image to view | Source: Customer Magnetism
Turning dry into fun
Another interesting case study is this cloud computing infographic published by Sungard. Cloud computing is a rather technical. And may be considered a dry topic for the less technically-inclined person. However, Sungard shows us how a timely, well-done infographic can change all that.
In September 2012, US Center for Disease Control and Prevention (CDC) adopted a novelty approach to educating the general public about the importance of disaster-preparedness. The organization launched “zombie apocalypse” campaign that teaches the US citizen on how to prepare for disasters—such as zombie attacks. This campaign is on the premise that: When you are able to deal with zombie pandemic, you are able to deal with just anything.
Sungard saw potential in adopting the similar premise in cloud adoption. In an unmistakable stroke of brilliance, Sungard made an infographic about cloud adoption, based on the concept that moving your business to cloud is actually similar to surviving a zombie attack.
The results? The zombie themed effort resulted in:
- 300% exceeding download rates
- 5.7% email open rate
- 20+ leads
It also brought them the Best Theme award from the Killer Content Awards 2013, subsequently getting more recognition and traffic.

Click image to view | Source: thecloudinfographic.com
Nicholas Reese, the chief executor of Microband Media in New York have this to say about infographic:
Infographics are outstanding for bringing life to content that would otherwise be dry, uninteresting or unshareable. Given their advantages, infographics have become an essential tool in our marketing strategy because they are a great avenue to get additional social media exposure — along with the SEO benefits of having additional links when our infographics are embedded.
He subsequently quotes their most popular infographic, Tax Myths #2 as being instrumental in spreading awareness to common tax myths, all while bringing additional exposure to the TaxReceipts brand via links and traffic.

Source: taxreceipts.com
Promoting your content
Infographics also work as a product promotion tool in content marketing. Lattice Engine demonstrated this approach neatly. They used an infographic to simplify and visualize Big Data. Partnering with CSO Insights, a research firm, they came up with a comprehensive report that details the challenges that impact sales teams across the globe. Using the infographic shown below, coupled with a mix of several other content marketing tactics, they have successfully promoted their report to the extent that it was:
- downloaded 500 times
- featured by 15 blogs and other industry media sites

Click image to view | Source: Lattice Engine
Now, while infographics are good and can stand alone on their own. You can also mix and match it with other content-marketing tactics to get maximum return. Demandbase provided a great insight using this approach. They created an education campaign to help B2B marketers make the right content technology investments to maximize the power of content. In the core of their campaign, they integrated infographics into their slide presentations as shown below.
The results of the campaign included:
- 1,700 leads
- 125 webinar participants
- 5,000 views on Slideshare
- $1 million in new business
Content Marketing Technology Vendors from Content Marketing Institute
Are you convinced of the power of infographics, yet?
If you have yet to use them as part of your marketing strategy today, it is time to consider growth hacking with infographics. Crafting a good infographic would take time, research and effort.
Fortunate for you, there are many infographic tools available today that will put you one step nearer towards your goal in generating returns. And of course, we recommend Piktochart.
Happy Piktocharting!


