Year 2016 was a memorable one for the world. Despite surprising us and challenging us, it was full of stories that made us smile and we are grateful for those!
For Piktochart, 2016 was an eventful year as well. Full of new feature launches, collaborations with inspiring partners and events led across the globe (also by our awesome users). Many new Pikto Geeks came on board and five new babies joined our extended Piktochart family.
Here are the highlights of what happened in 2016, presented to you in the form of a familiar name: PIKTOCHART 🙂
Ready? Here we go!
P for Product
On a mission to make Piktochart smarter, more beautiful and easier for our users, our three teams including Core, Growth and Labs (CGL squad) worked hard throughout this year to deliver these main features:
- More privacy settings – we protected your visual creations with a password so you can share them only with your chosen audience
- Improved object resizing – you can now resize the width and height of your visual elements separately without changing their entire size and shape
- New icon categories – we categorized all icons into Mono-color and Multi-colored ones. It makes icon-filtering faster and more efficient!
- Login textbox pointer – we made logging in to Piktochart faster and hassle-free by reducing one unnecessary click. You can now get started on your visuals quicker!
- New contact page – in order to sort through your requests quicker and have more information upfront to serve your better, we introduced changes to the contact us page that now has more categories and organized information
- Template selector – we improved the process of selecting templates to help you find what you’re looking for with ease
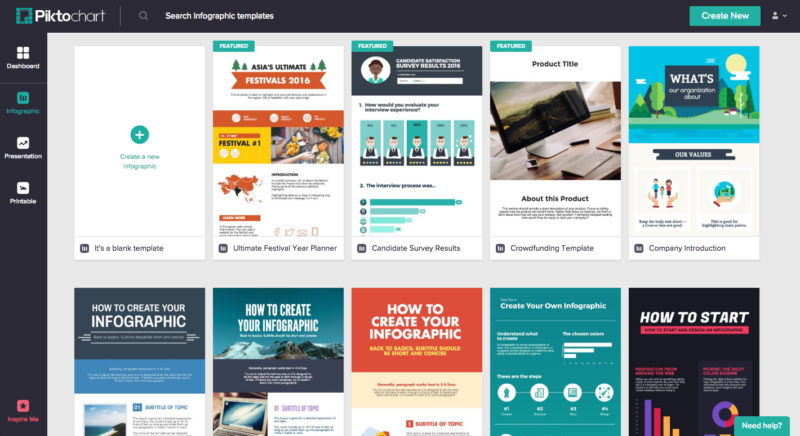
- BIG ONE: Dashboard & Facelift – we made revisions to our user interface and modernized the editor to make it even more intuitive and easier to use as well as more pleasant to look at. We also introduced the D A S H B O A R D and made it your new Piktochart homepage once you sign in. It’s where we keep your saved visuals and make choosing formats (now categorized into: Infographic, Presentation and Printable) much easier.
Geek alert: All the product and feature launches took 778 code commits!
Apart from all the features that made the creation process easier, the CGL teams also rolled out a few internal improvements that helped us get to know our customers better and declutter our database. Those include:
- Email validation – every new user now needs to confirm their email which reduces spam and keeps our database uncluttered.
- Signup poll – in order to onboard and guide our users to success in a more targeted way, we released a survey to get to know them a little better.
I for Infographics
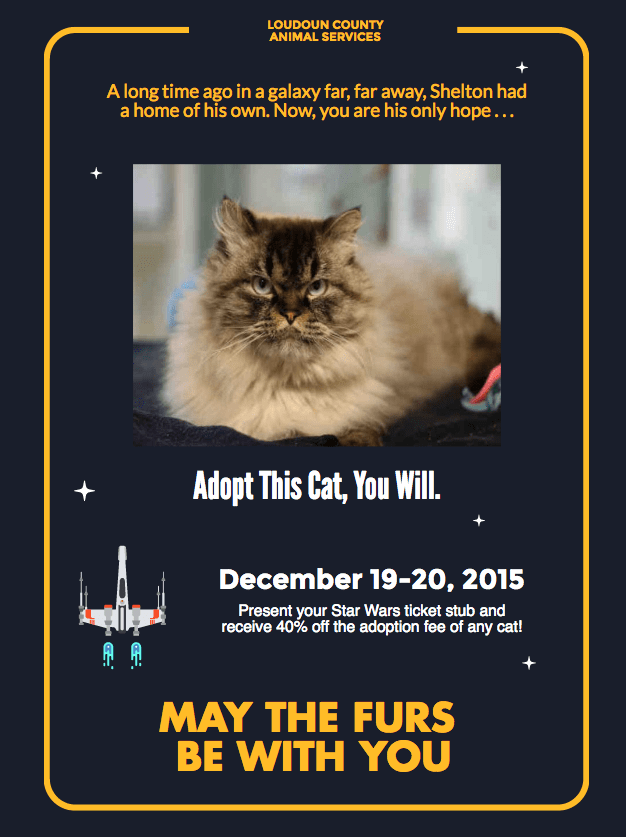
Infographics are bread and butter for us at Piktochart and helping our users make their communication stand out in unique ways is our mission. This year we’ve seen it all, from infographics about ethical fashion, health and politics, to case studies, resumes, yearly summaries, event invites and even cat adoption posters:
To date, 17.3 million Piktocharts have been created amongst infographics, presentations and posters. In 2016 alone, 8.3 million visuals were designed! All this was possible with four 24/7 servers scaled up to 10 on-peak hours!
The most viewed infographic on Piktochart this year a.k.a THE infographic that crashed our servers was this one about the results of US Presidential Elections published by the French online news portal L’OBS.
This instructional infographic about steps in meditation, however, was among the most shared ones on social media.
K for KNOWLEDGE
Getting to know our users
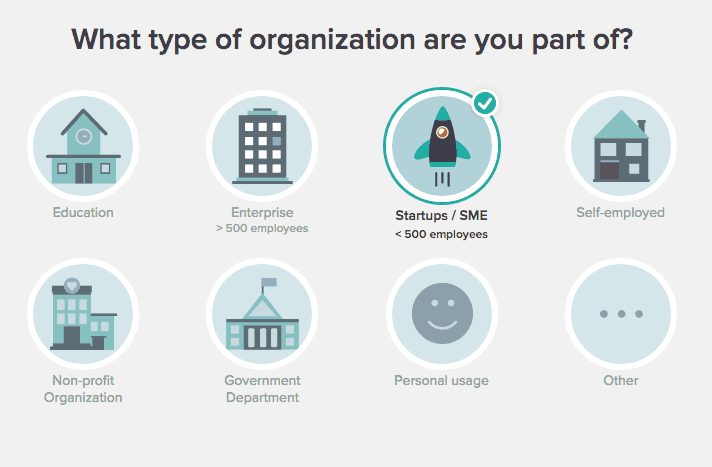
This past April, we turned four years old and reached a new height of five million users worldwide. It was certainly a milestone for us, and it was something to celebrate! But knowing that people in large numbers are using our product doesn’t answer the most important question: “Who are they and why are they using Piktochart?” That burning question was the reason we chose to work with a Jobs-to-be-done framework to understand what jobs users “hire us” to do. At the end of our research, we were able to boil down five million users into eight persona characters. Knowing their pain points and reasons for creating visual projects allowed us to start designing our product and communications more consciously.
The power of community
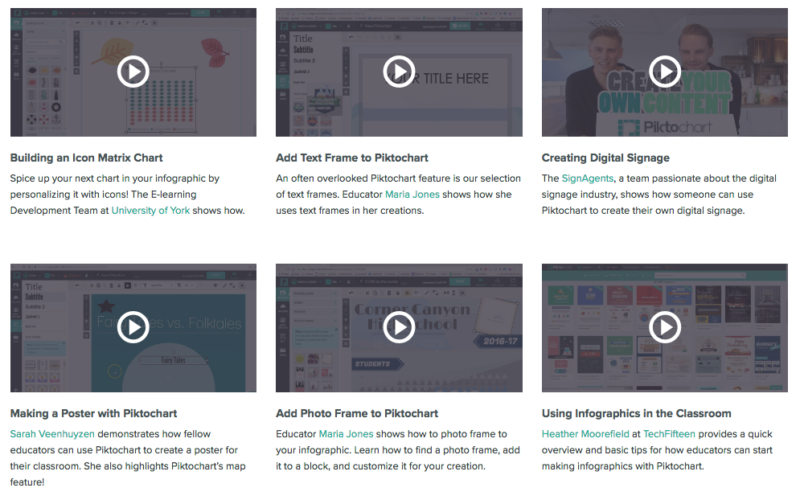
We consider ourselves lucky to be able to count on an engaged community of users who continuosly spread the word about us. One channel where the community is most active is YouTube. There are quite a few videos created by our talented users keen on sharing their knowledge and educating others on how to use our platform. We decided to showcase those incredible people by putting their videos in front of more users to serve as useful tutorials and how-to’s with a video gallery which we populate with more material every month.
Helping our users master the art of visual communication
One of our goals was to help our users be more successful in Piktochart and make their journey with visual design easier and hassle-free. Our blog, available both in English and Spanish has been our main information outlet where we not only help users become better at visual communication, but we share our lessons as a growing startup as well.
This year alone, we published 120 blog articles (including 23 guest ones) from Design, Education, Marketing and Culture categories including seasonal design inspirations, tips for marketers and teachers, Piktochart hacks, shared experiences about our startup journey, culture, working habits and many more!

T for Teams
Truly international team
People a.k.a Pikto Geeks are what makes our culture truly special. This year, we welcomed 18 new talented people on board and reached a total amount of 55 employees including 10 remote ones.
We were spread across more than eight countries with one team member traveling around the world with Remote Year and Hacker Paradise.
We also spoke 21 languages:
English, Bahasa Malaysia, Bahasa Indonesia, Mandarin, Cantonese, Hokkien, Hakka, Korean, French, Italian, German, Spanish, Polish, Teochew, Tamil, Tagalog, Vietnamese, Bisaya, Urdu, Hindi and Punjabi.

And celebrated the births of five new Pikto-babies!

Calling on the data crunchers
One of our goals for 2016 was to become more data-driven to help us prioritize tasks, make decisions and guide our way through product development and marketing. That’s why we assembled a team of data enthusiasts to encourage everyone in Piktochart to be more data-driven in their decision making. Through research and analysis, data crunchers turned raw data into actionable insights for all the teams company wide, challenged us, asked much needed questions and helped us move forward.
The birth of CGL
Prior to 2016, we had a “teams based on expertise” structure. To move the product and company forward in a more efficient way, we decided to introduce three functional teams: Core, Growth, and Labs. Each team had their own mandate, product manager, set of objectives and was focused on improving different stages of the user journey by leveraging on unique technical skills.
O for Office
There’s no place like home and for us, it’s our lovely HQ located on sunny Penang Island in Malaysia. Apart from being our beloved working space, it also turns into an event venue, yoga atelier and a rehearsal spot for our boy band (yes, we do have one!).
Regarding our employees’ health and well-being, we started catering breakfast and lunch and invested in customizable ergonomic Steelcase chairs.
Here’s a video we filmed last spring in our HQ:

C for Community
Users who continue trusting us are what keeps us motivated and inspired every single day. We’re so grateful for every heart-warming Tweet and mention that comes our way! Cultivating each and every relationship and empowering users to reach their creative potential and share their knowledge has always been one of our priorities.
So proud of my son today for doing so well at the #DarTechFair! 3 wins thanks to @piktochart @gotynker and @SketchUp! #ProudMom #LoveMyMaker pic.twitter.com/mVCcvkUn2P
— Beth Wardlaw (@Mrs_Wardlaw) November 2, 2016
Here’s what happened on the community strengthening front in 2016:
- Reached 600 #PiktoTour attendees up to date in 17 countries, including user-led events.

- Collaborated with more than 16 organizations including UN Women, Tech Girlz, Typeform and Indiegogo just to name a few
- Launched our Spanish blog and a Twitter account in Spanish to support our second biggest spoken language among users
- Shipped 320 swag gifts including “Make Information Beautiful” tees, stickers, cards and more
@piktochart is A M A Z I N G! Great site & great staff that really listens. (((hugs))) pic.twitter.com/uOEpHl03aW
— Linda @GeoBlend (@GeoBlend) September 6, 2016
- Launched the #PiktoTakeover series on Instagram where Pikto Geeks shared their stories, passions and dreams

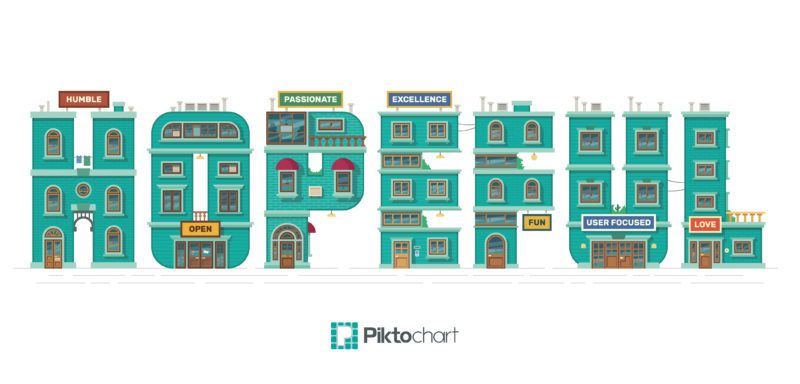
H for HOPEFUL
Everything we do (we do it for you, of course) stems from our core values; seven values form the word HOPEFUL define our culture and drive our actions and decisions.
This year, we were certified by The WorldBlu organization as one of the top freedom-centered workplaces worldwide and we intend to keep recognizing our employees, listening to each other and giving constructive feedback to help us improve and evolve. Here are some highlights on the culture front this year:
- Introduced radical candor – in order to help each other grow and drive positive change, we encouraged all employees to implement radical candor into their 1:1s and to voice their concerns in a caring, transparent yet direct way. While we practice this every day, we’re still looking to improve.
- Launched Pikto Academy – it has become increasingly challenging to find experienced web developers in our neck of the woods, so we decided to act upon it! We organized a Pikto Academy whose mission was to train newly graduated talents and help them shape their knowledge. The best performing trainees would then stay and work alongside us.
- Collected feedback via Officevibe – the constant will to improve motivated us to invest in a tool called Officevibe that helped us collect bi-weekly engagement feedback. We asked about recognition, benefits, challenges, happiness and more. Thanks to this, each team leader could work on specific areas of improvement based on their team’s feedback.
- Gave recognition via Bonus.ly – once upon a time we used to hide hand written notes in cups with everyone’s name on them. Since we became more remote-friendly and wanted to pay our love forward, this unique tradition got replaced by Bonus.ly where we gave each other points for living company values, by demonstrating good teamwork, leadership or innovation. At the end of each month, all the points gathered could be exchanged for benefits (e.g. Uber credits) or charity donations.
- Became more remote-friendly: there are 10 of us working remotely now and in order to make things even friendlier for those outside the office, we moved our weekly meetings to afternoons so more people could attend in real-time. We also invested in proper conference software and gear to introduce higher quality to all meetings including our new monthly virtual coffee sessions where we share fun stories and experiences
- Asked questions and listened – we believe in transparency in what we do and think each employee has the right to ask difficult questions. In order to address those, we held weekly APA (Ask Piktochart Anything) sessions where one person would address one of the anonymous questions via Upvoter
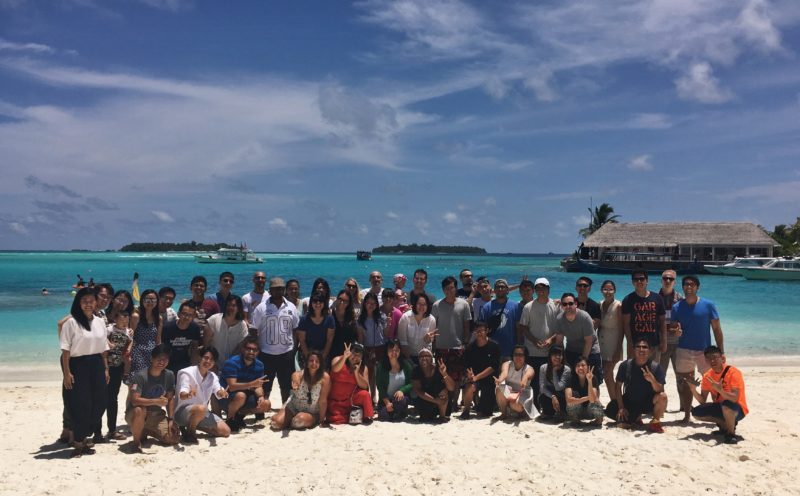
- We traveled to an exotic island – for the second time in history, we went on a company-wide annual retreat to the beautiful Maldives. Those sunsets will always remain in our hearts!
A for AGILE & AUTOMATED TESTS
The more we grow, the more we need processes to keep things smooth, effective and moving in a healthy pace. We took a deep look at the way we ran projects and decided to call on:
- Agile methodology – previously, our projects received little feedback during development and instead it happened at the end of a long development cycle (typically a couple of months) which caused some projects to be delayed immensely due to rework and concerns when they were finally reviewed. We felt that Agile could help us solve these problems by implementing shorter development iterations and constantly reviewing the code and testing the features as we developed them. Although we are still adopting Agile, we’ve already started discovering communication gaps and issues quicker thanks to to the shorter iteration cycles.
- Automated tests – we started adding automated tests to our code in order to minimize the possibility of any undesirable outcomes that might frustrate our users. These tests act as a gatekeeper to check through any new app updates we launch to ensure that a button should still behave like a button, and an upload actually uploads properly. With this new practice in place, we reduce the amount of time we spend to manually test while ensuring that our users have a stable and reliable app all the time.
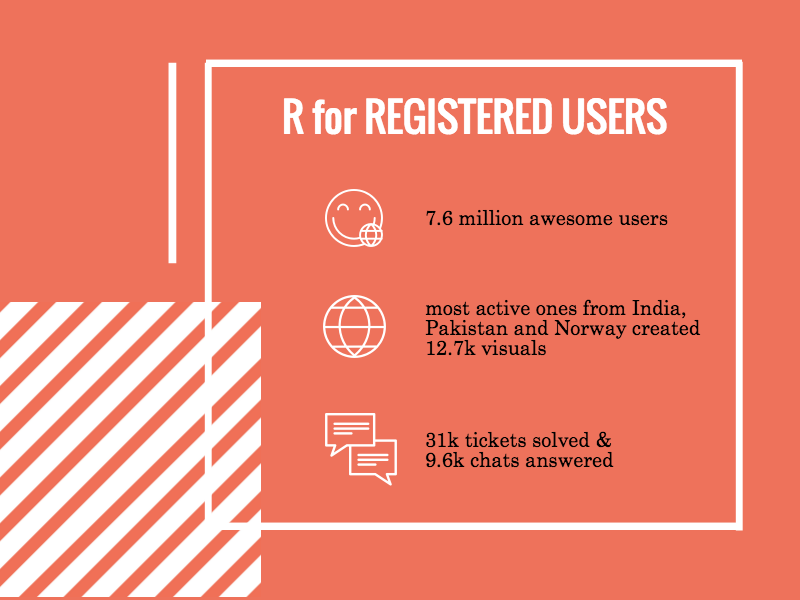
R for REGISTERED USERS
The amount of people signing up to Piktochart every day never ceases to amaze and humble us. This year, we hit an incredible 7,594,567 registered users. Our most active ones came from Pakistan, India and Norway and created 12,770 visuals in total.
Our customer delight team was on their toes talking to users and solving problems.
We had:
- 31,100 tickets solved AND
- 9,617 live chats
T for TEMPLATES
Beautiful, easily customizable and versatile templates are one of the things that sets us apart from others.
This year, our design team created 129 new templates and revamped 13 existing ones reaching the total amount of 620 templates available.
We’ve also diversified our design assets collection by adding 765 new icons and 995 photos to our gallery.

Thanks to you, 2016 was full of amazing moments and great lessons. We are constantly learning from you on how to keep delivering a great user experience so that you can keep creating visual projects and more in the year that’s to come!
Stay hopeful!